The primary sources of black carbon (BC) emissions are the residential, transportation, and industrial sectors. The residential sector is the largest contributor to BC emissions, accounting for approximately 48% of global BC emissions in 2017 (Figure 2.1). Residential sector BC largely comes from the use of solid fuels such as wood, charcoal, agricultural residues, dung, and coal for heating and cooking, which is still widespread in low- and middle-income countries, where approximately 2.4 billion people, or one-third of the global population, rely on it.
Sources, Regional Patterns, and Trends
Figure 2.1 — Anthropogenic sources of BC emissions. Data source: CEDS GBD-MAPS
Image
The transportation sector is the next largest source of BC, accounting for 24% of global emissions. It is emitted from a variety of sources, but most of the emissions are from diesel vehicles – including ships – which produce higher levels of BC due to their combustion process. BC emissions from transportation can be significantly reduced by retrofitting older diesel engines with diesel particulate filters (which can remove up to 95% of BC), using low-sulfur fuels, or replacing diesel with hybrid and electric vehicles.
Industrial BC emissions arise mainly from brick kilns, industrial boilers, and coke ovens used in iron and steel production. China, India, and countries in Central and South America are the primary contributors to industrial BC emissions. Industries in developed countries have managed to reduce BC by adopting a combination of measures including fuel switching, enhanced combustion processes, and strict air quality regulations. Industrial emissions could be reduced by phasing out beehive coke ovens, transitioning from traditional brick kilns to vertical shaft brick kilns, and promoting end-of-pipe dust removal facilities.
Open biomass burning, wildfires, and controlled agricultural burning are also significant contributors to BC emissions. Wildfires, in particular, introduce substantial quantities of BC particles into the atmosphere, especially in the Arctic. In parts of Asia, Africa, and South America, agricultural burning releases large amounts of BC into the atmosphere.
Image
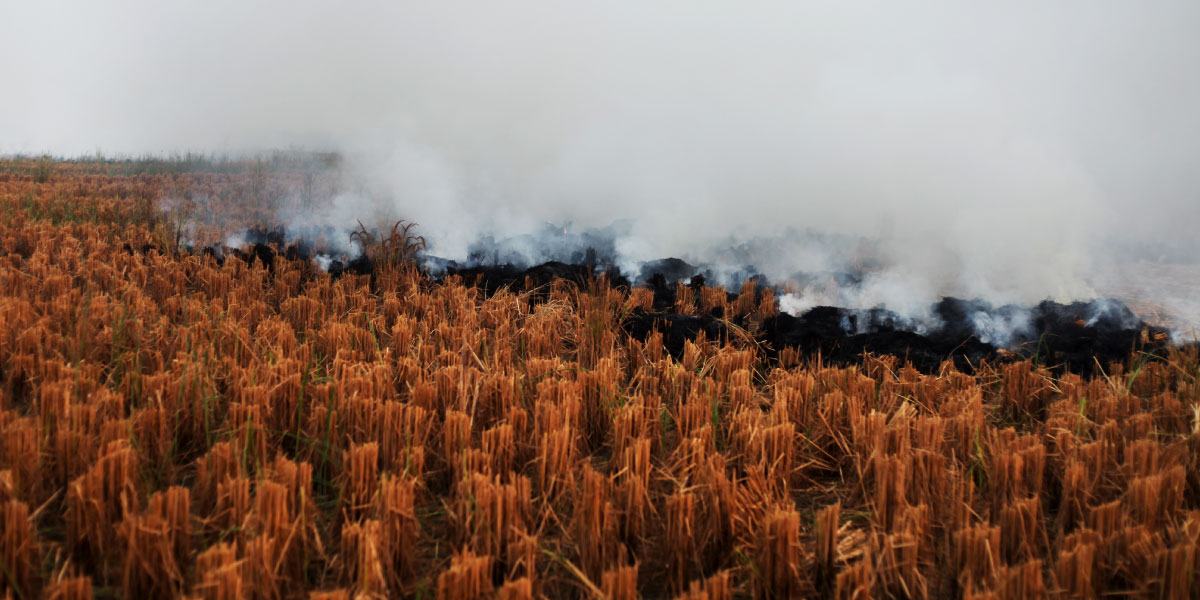
Black carbon and other pollutants being emitted from the burning of a dry rice paddy in India.
Credit: Credit: rvimages / iStockTo identify geographical sources and trends we chose two recent datasets – the Community Emissions Data System (CEDS GBD-MAPS) and the Peking University global emissions inventory (PKU-FUEL) – that provide country-level and sectoral BC emissions from 1970 to 2017.
Be a Project Drawdown insider!
Sign up for our newsletter today.
BC emissions inventories have a notable amount of uncertainty due to a variety of factors constituting a significant barrier to mitigating emissions. While there is an urgent need to improve estimates, existing inventories can still be useful, particularly when developing short-term mitigation strategies. We have provided a brief comparison between the two inventories used here and other major inventories here.
2.1. Highest Emitters
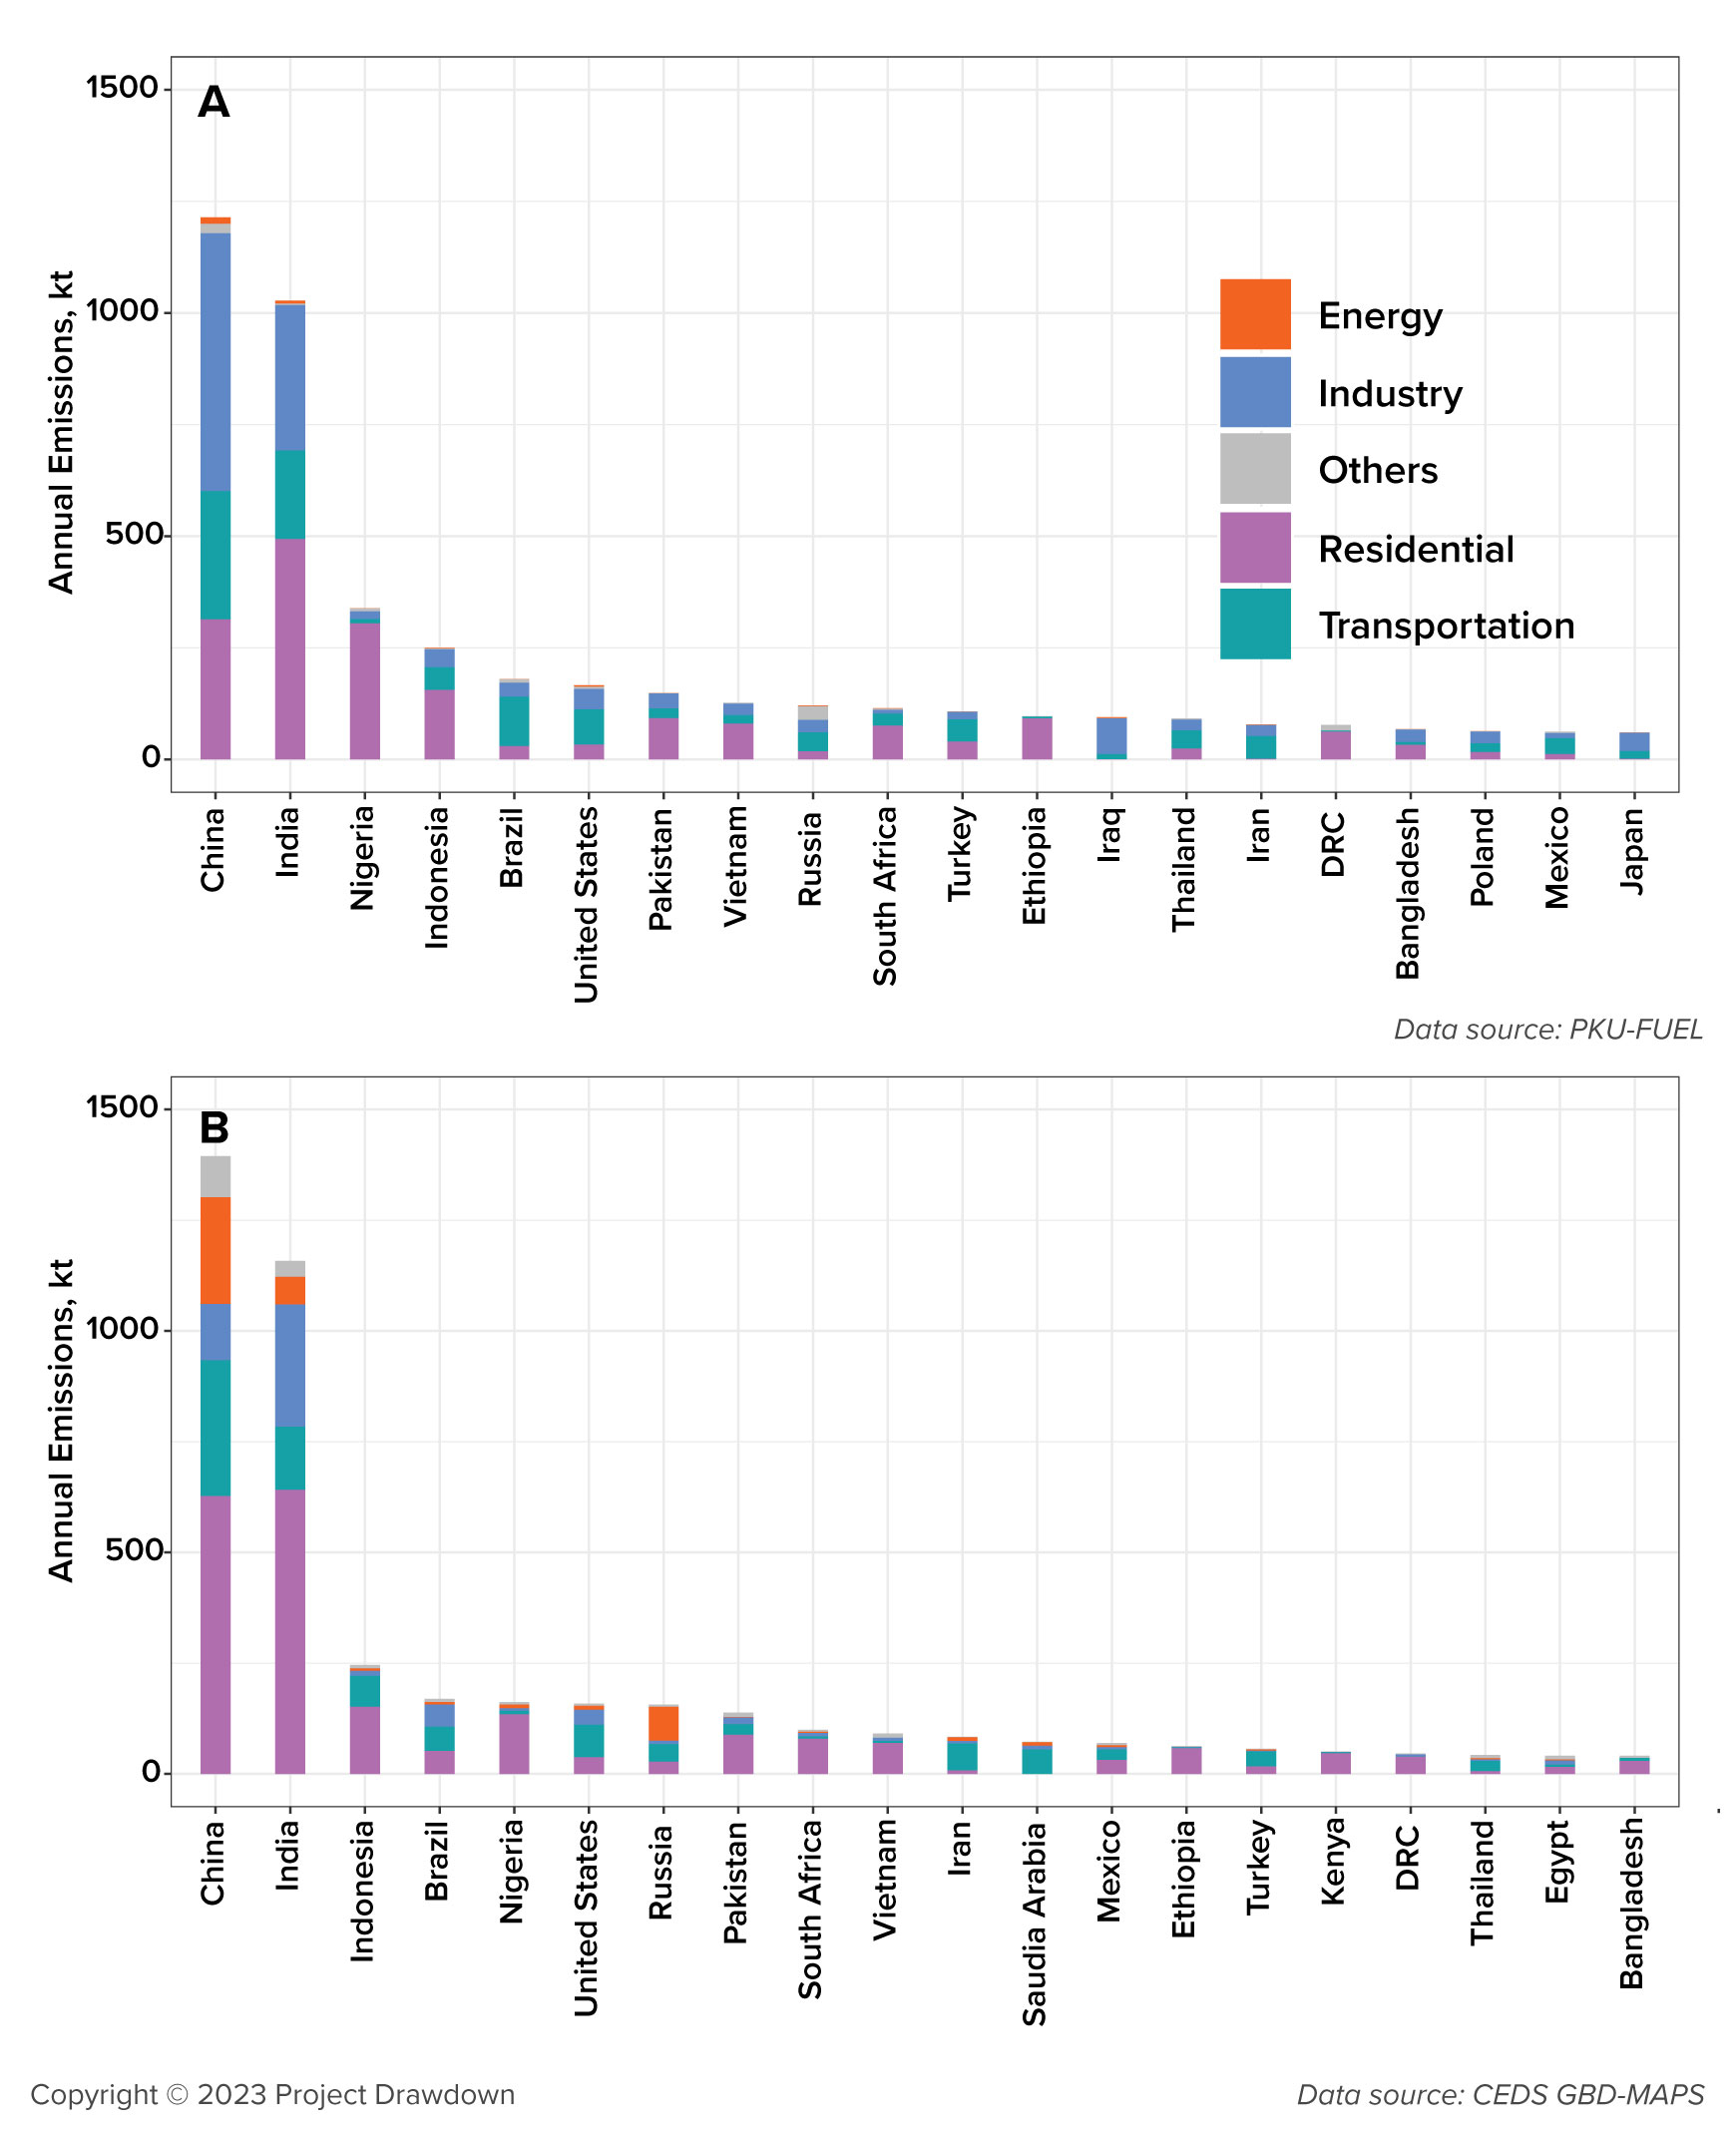
There are large country variations in BC emissions – both in terms of the amount and sources of emissions. Global BC emissions are dominated by China and India, which together account for one-third of global anthropogenic emissions, followed by Brazil, Indonesia, and Nigeria. These five countries together account for half of total global BC emissions, as shown in Figure 2.2. For India, Nigeria, Indonesia, and Brazil, the proportional sectoral contributions between the two datasets (PKU-FUEL and CEDS GBD-MAPS) are in broad agreement with each other. However, for China, according to the PKU-FUEL inventory, industrial BC emissions are the country’s single largest source of BC. But according to the CEDS GBD-MAPS inventory, China’s residential and energy sectors are a substantially larger source of BC emissions than industry. This discrepancy might result from the low emissions factors used in the CEDS GBD-MAPS inventory for the industrial sector.
Figure 2.2 — Black carbon emissions broken down by sector for the top 20 highest-emitting countries in 2017. Data: (A) PKU-FUEL and (B) CEDS GBD-MAPS. (DRC: Democratic Republic of Congo)
Image
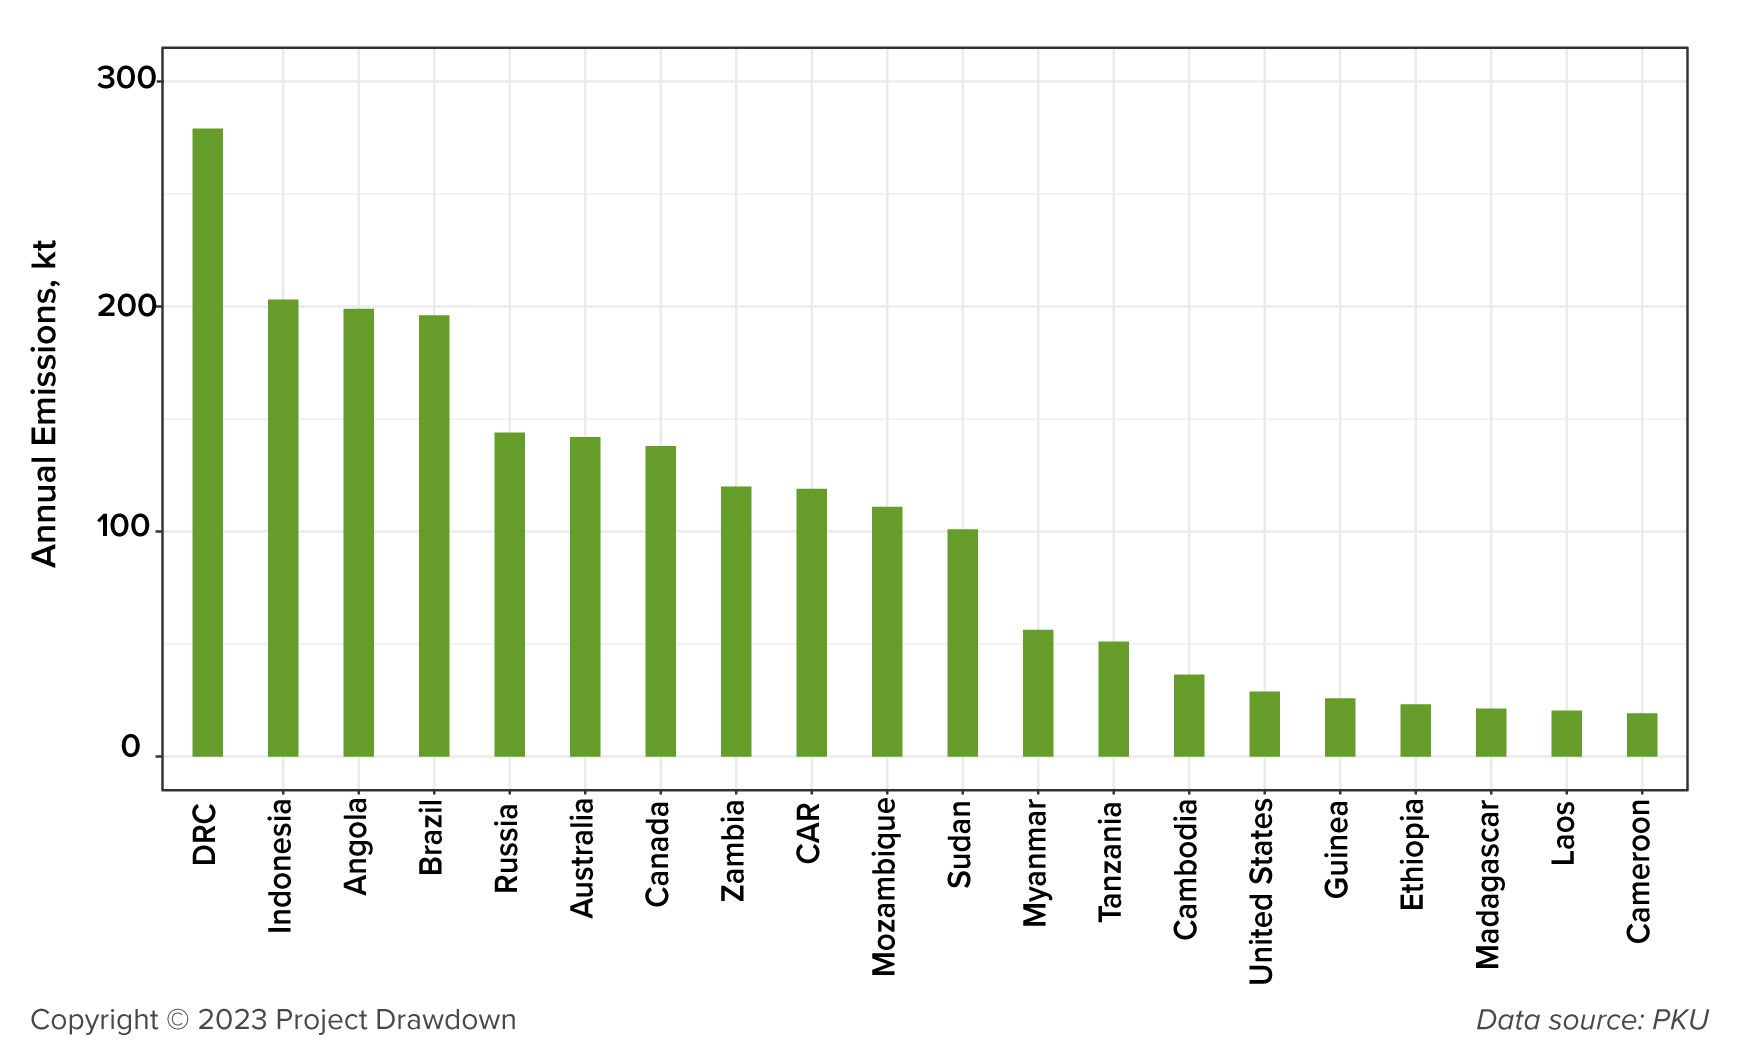
In several countries, such as the Democratic Republic of Congo (DRC), Angola, Russia, Indonesia, Brazil, and Canada, forest fires – natural and uncontrolled – and agricultural burning are also significant sources of BC (Figure 2.3). For example, it has been estimated that Siberian fires contributed almost half of all BC deposited in the Arctic over a 12-year period from 2002 to 2013. Similarly, a recent study reveals that savannah burning in sub-Saharan Africa is a significant contributor to BC emissions.
Figure 2.3 — Wildfire-related black carbon emissions for the top 20 highest-emitting countries in 2017. Data: PKU-FUEL. (DRC: Democratic Republic of Congo; CAR: Central African Republic)
Image
2.2. Regional Patterns
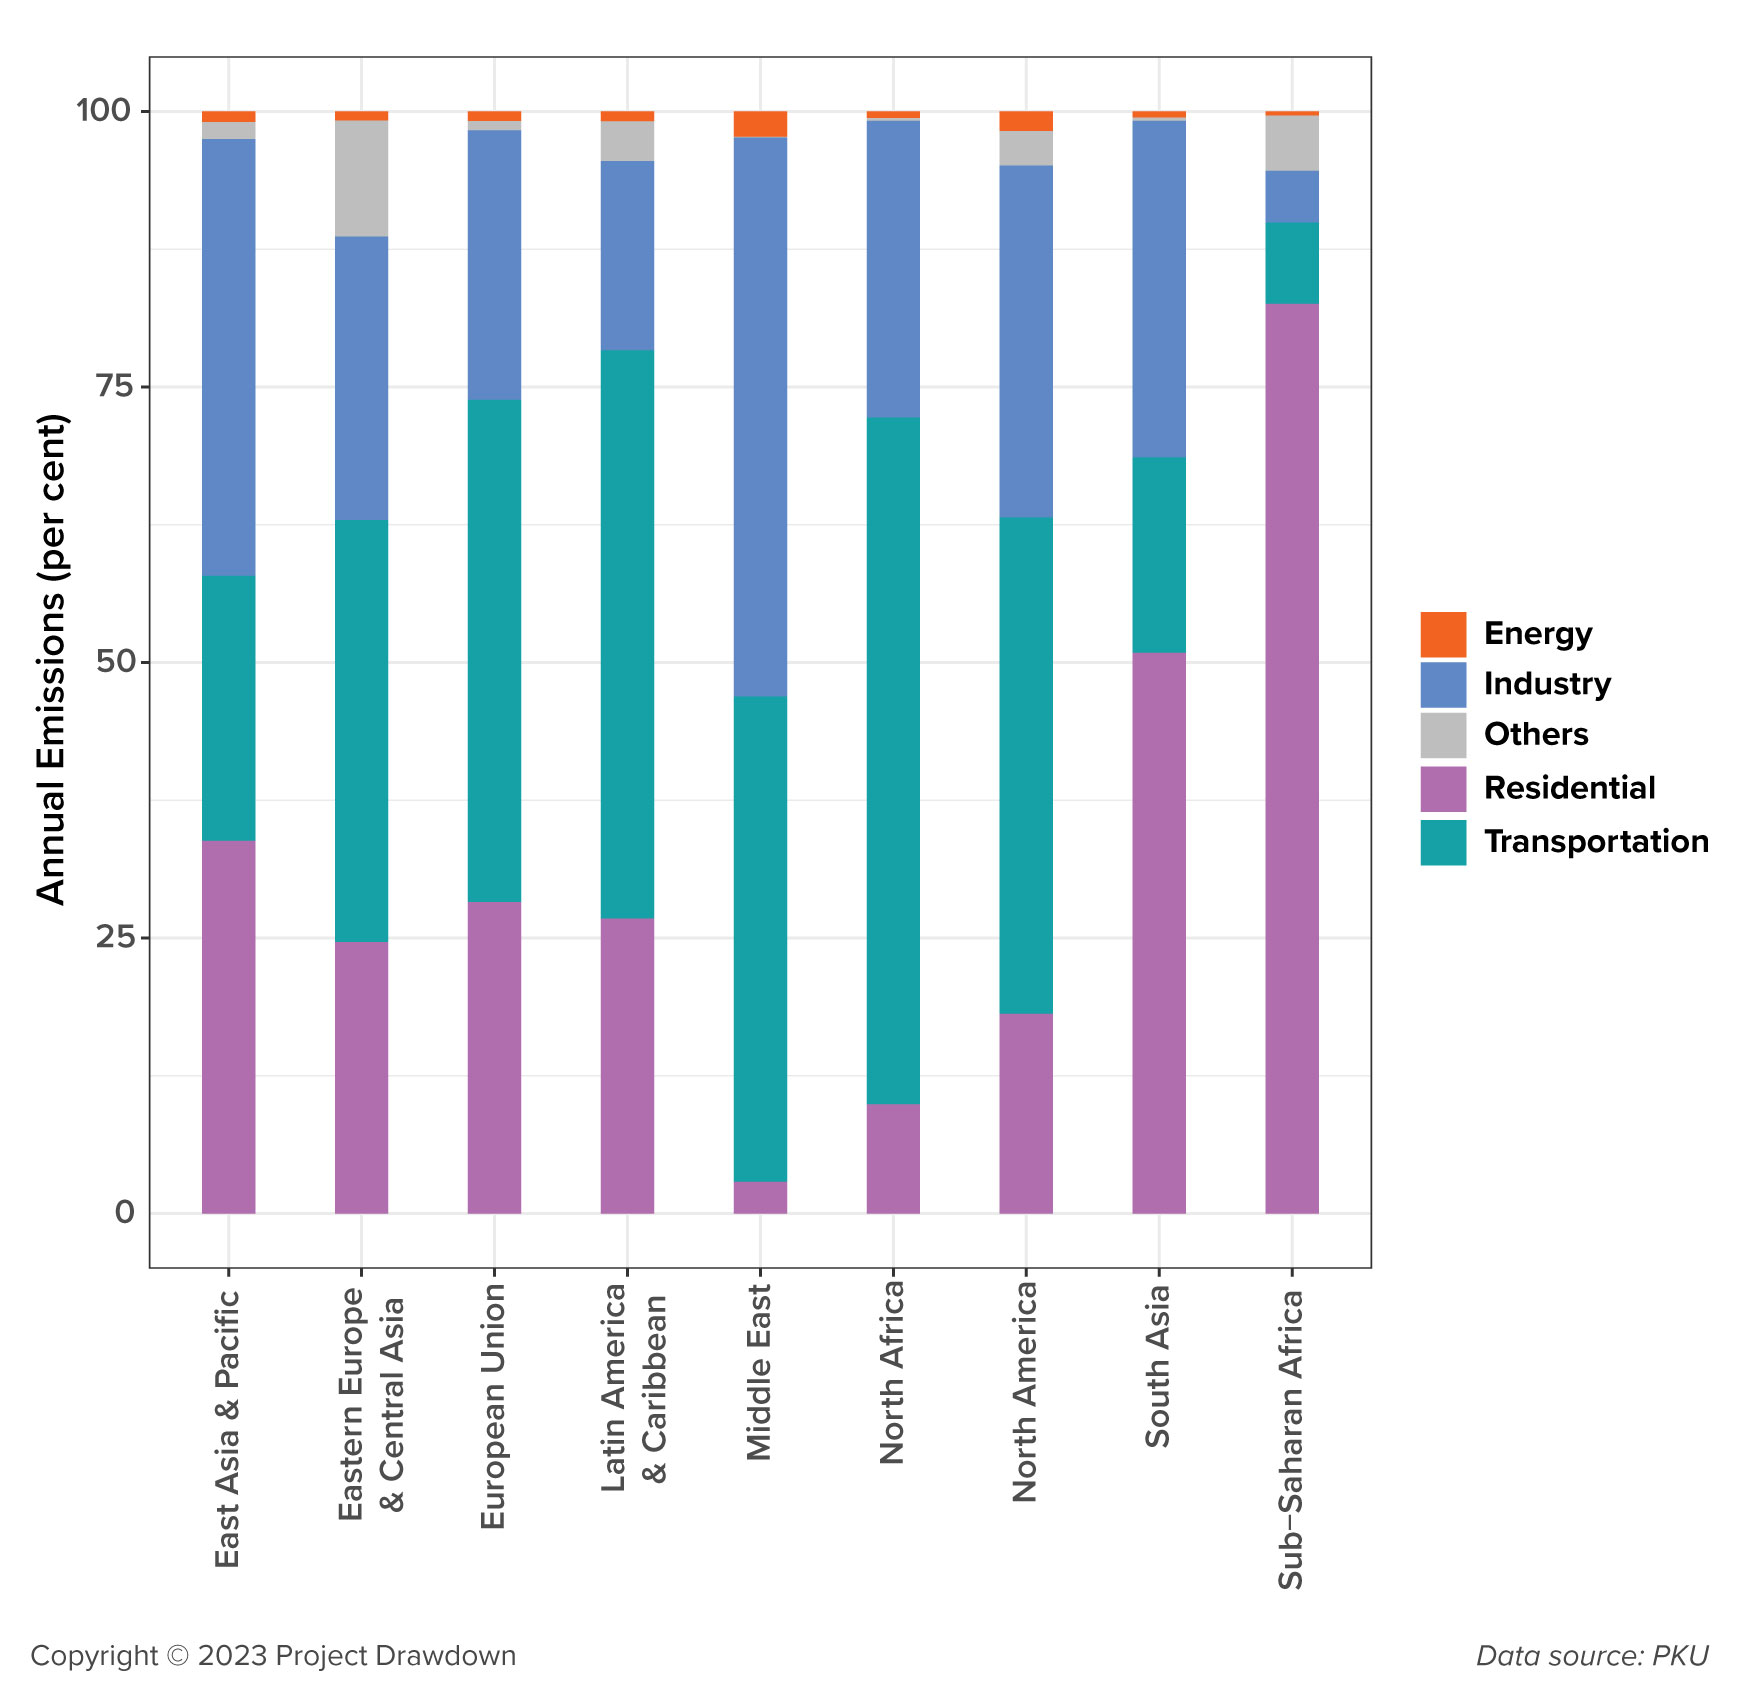
Aggregating countries reveals large variation in the sources of BC emissions at a regional level. Transportation is the largest contributor to BC emissions in North and South America, Europe, North Africa, and Central Asia, accounting for approximately half of total emissions, as shown in Figure 2.4.
In East Asia, BC emissions are relatively equal across all three major sources – transportation, residential, and industry.
In the Middle East, BC emissions are dominated by the transportation and industrial sectors, the latter being associated with fossil fuel activities in the region’s oil-rich Gulf countries.
In South Asia and sub-Saharan Africa, which together account for about 38% of global BC emissions, the residential sector stands out as the primary source of BC. Notably, the residential sector in sub-Saharan Africa is responsible for more than 75% of the region’s BC emissions due in large part to the combustion of unclean fuels for cooking and heating.
Figure 2.4 — Percent contribution of various sectors to 2017 black carbon emissions by region. Data: PKU-FUEL
Image
2.3. Black Carbon Hotspots
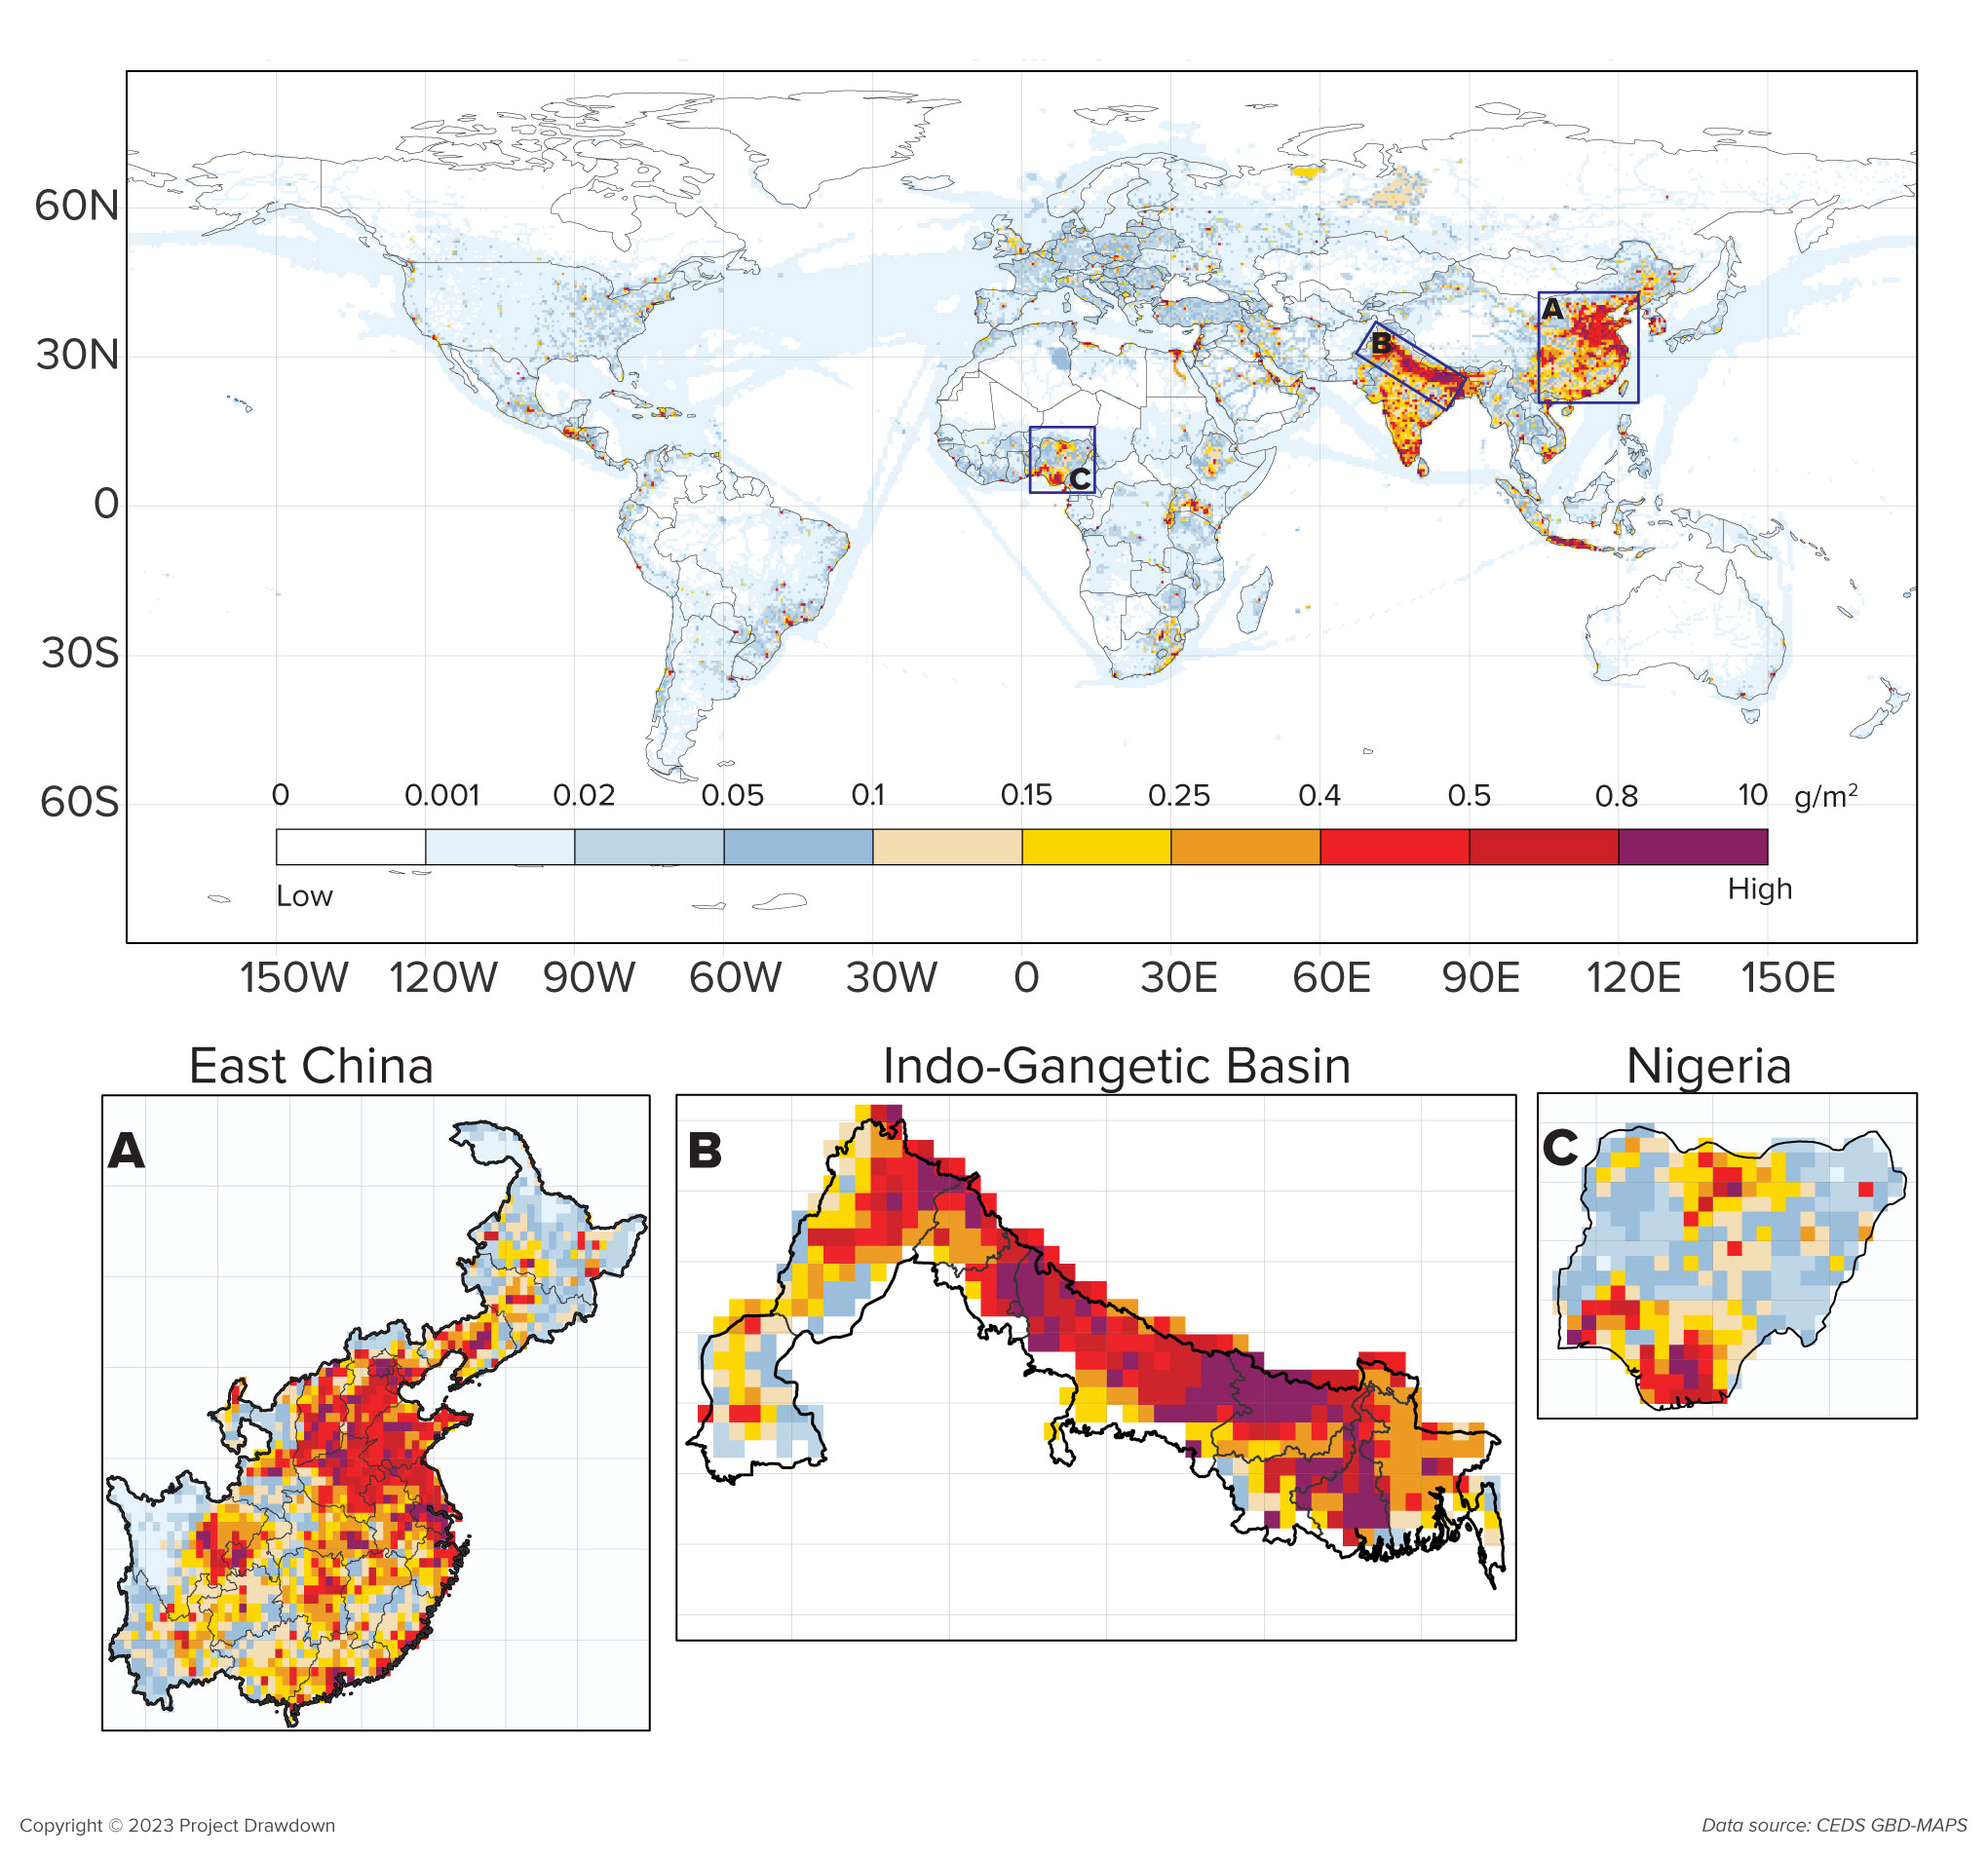
A small number of locations are responsible for a disproportionately large amount of BC emissions. For example, as shown in Figure 2.5, around 20% of global BC emissions are concentrated in eastern China and the Indo-Gangetic Plain. By elucidating the regional and sectoral hotspots of BC emissions, stakeholders can take a targeted approach to deploying solutions that will quickly and significantly reduce BC while maximizing human and environmental well-being.
In China, industrial activities, residential fuel combustion, and transportation all contribute heavily to BC emissions. The Indo-Gangetic Plain, encompassing regions in northern India, Pakistan, and Bangladesh, emerged as the most substantial hotspot for residential emissions, accounting for approximately 25% of the sector’s BC emissions globally. Reductions across the Indo-Gangetic Plain will not only reduce BC exposure for more than 60 million people but would also reduce BC deposition in the Himalayas and the Hindu Kush mountains thereby slowing glacier melt. Residential hotspots are also observed in densely populated regions of eastern Indonesia and southern Nigeria.
Figure 2.5 — Spatial distribution of global annual black carbon emissions in 2017. The light blue lines in the ocean are black carbon emissions associated with global shipping. A, B, and C: Hotspots in eastern China, the Indo-Gangetic Basin across India, Bangladesh, and Pakistan, and Nigeria, respectively. Data: CEDS GBD-MAPS.
Image
Urban metropolises situated in Uganda, Egypt, Ethiopia, and South Africa represent significant anthropogenic BC hotspots within the African continent, with residential and transportation activities being the predominant sources of emissions. Collectively, these locations account for a significant portion of Africa's overall emissions.
Oil-producing Gulf countries like Qatar, the United Arab Emirates, and Iraq exhibit high BC emissions from the oil and gas sector which is co-emitted with methane. Notably, per capita emissions are particularly high for these countries, underscoring the disproportionate impact of oil and gas operations on BC emissions.
Shipping is responsible for approximately 2% of global BC emissions which would make it the fifth largest contributor if it were a country. The impact of shipping-related BC is particularly pronounced in the Arctic and northern latitudes, where these emissions have detrimental effects on fragile ecosystems and Indigenous communities. Worryingly, the quantity of BC emitted within the Arctic region has doubled between 2015 and 2021, primarily due to increased shipping activity in adjacent waters.
Finally, major urban centers globally, such as Rio De Janeiro, New York City, Mexico City, and London, are BC hotspots due to the extensive number of vehicles operating within these metropolises.
2.4. Global Trends
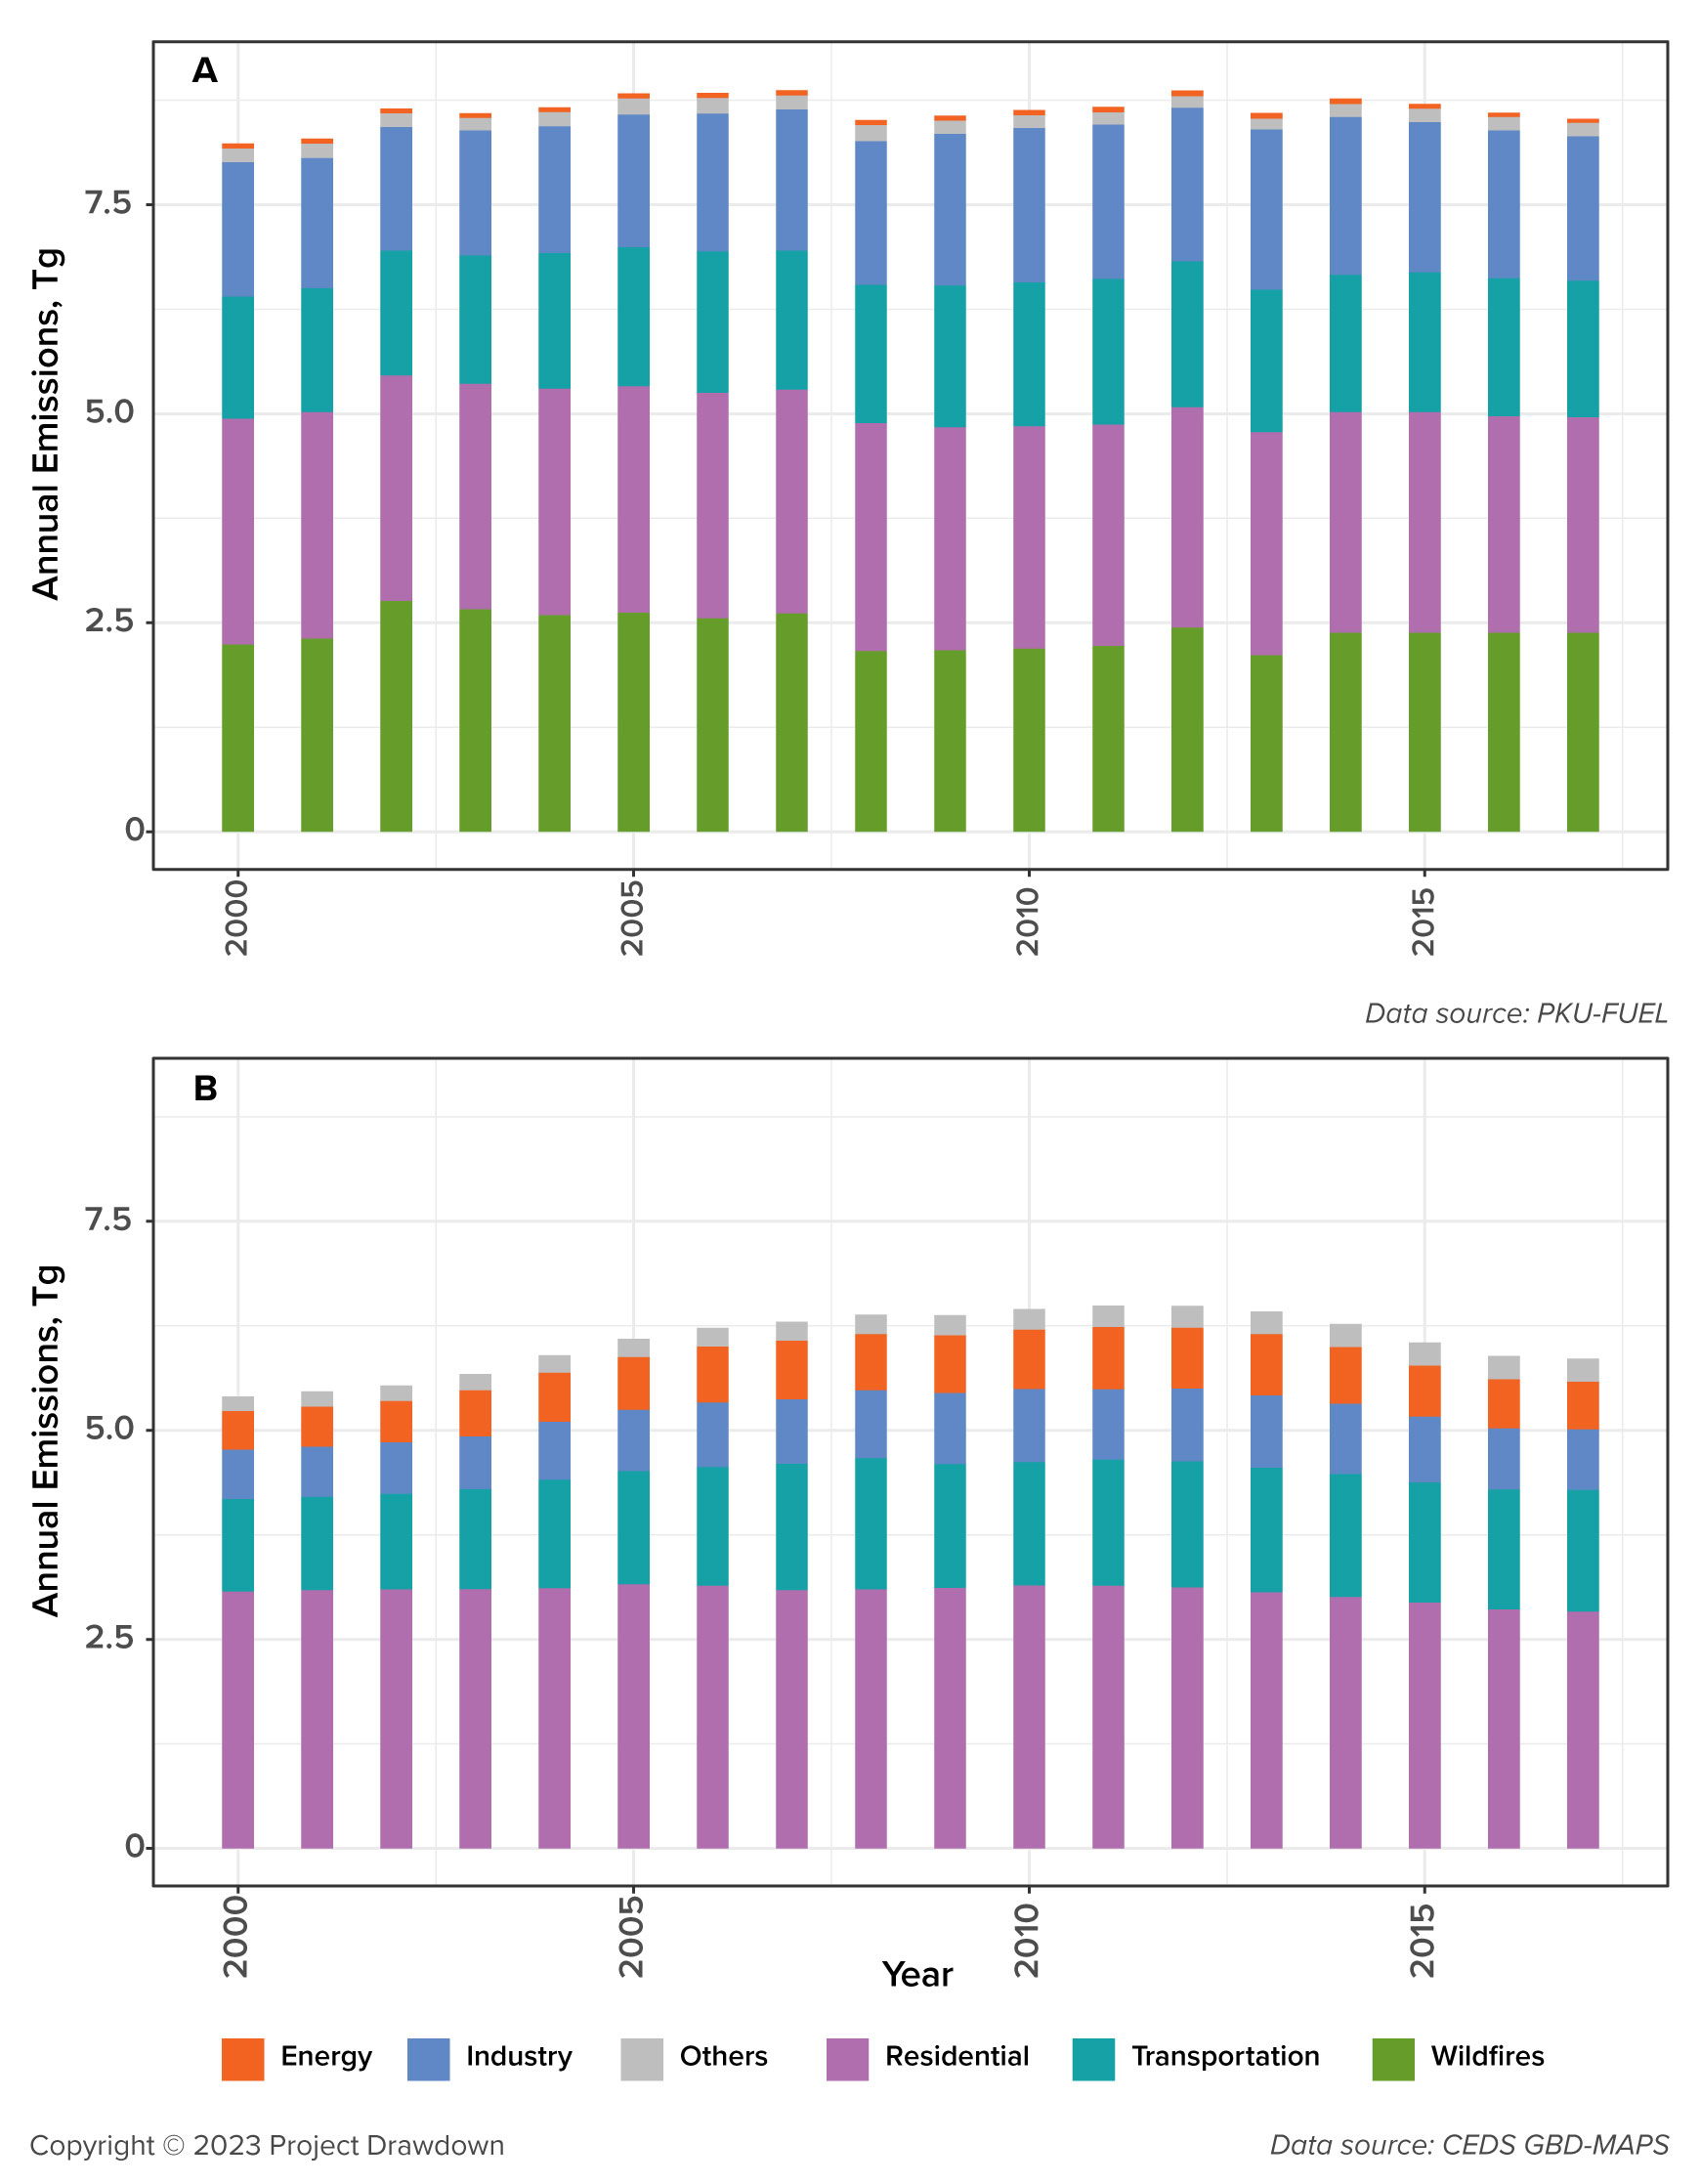
Human activities resulted in emissions of about 5 terragrams (Tg) of BC per year between 2000 and 2017. During the same period, wildfires and agricultural burning are estimated to have contributed between 2–2.5 Tg of BC per year. BC emissions have not shown a consistent increasing or decreasing trend over the last two decades, as shown in Figure 2.6. According to the PKU-FUEL dataset, global anthropogenic BC emissions have remained consistent at around 5.7 Tg per year. In contrast, according to CEDS GBD-MAPS, BC emissions increased from 5.2 to 6 Tg per year between 2000 and 2010 and then witnessed a small decline of 0.3 Tg between 2010 and 2017. Nonetheless, both datasets suggest that global reductions in BC emissions are not on track as recommended by the IPCC to achieve the Paris Climate Agreement goal of limiting warming to below 1.5°C.
Figure 2.6 — Global black carbon emissions and relative contributions by sector from 2000 to 2017. (A) PKU-FUEL and (B) CEDS GBD-MAPS . Note: CEDS GBD-MAPS does not include emissions from wildfires.
Image
When examining emissions at the regional level as opposed to the global level, substantial disparities become evident. BC emissions have declined in Europe, North America, China, and other developed countries, as shown in Figure 2.7. Much of the recent decline in the northern hemisphere is attributable to China, where emissions dropped by 20% between 2010 and 2017. However, even with this decline, China accounted for approximately 18% of global BC emissions in 2017. In the United States, BC declined by 16% over that same timeframe primarily due to a large drop in transportation-related emissions following the implementation of stringent vehicle emission standards. In the European Union, BC emissions decreased by 6% over those seven years. However, this decrease was not uniform across member states. BC decreased by more than 15% in Italy, Norway, Sweden, Greece, and Belgium, but much lower in larger countries, such as Germany and France.
Figure 2.7 — Percent change in country-level anthropogenic black carbon emissions between 2010 and 2017. This does not include emissions from wildfires. Data: PKU-FUEL.
Image
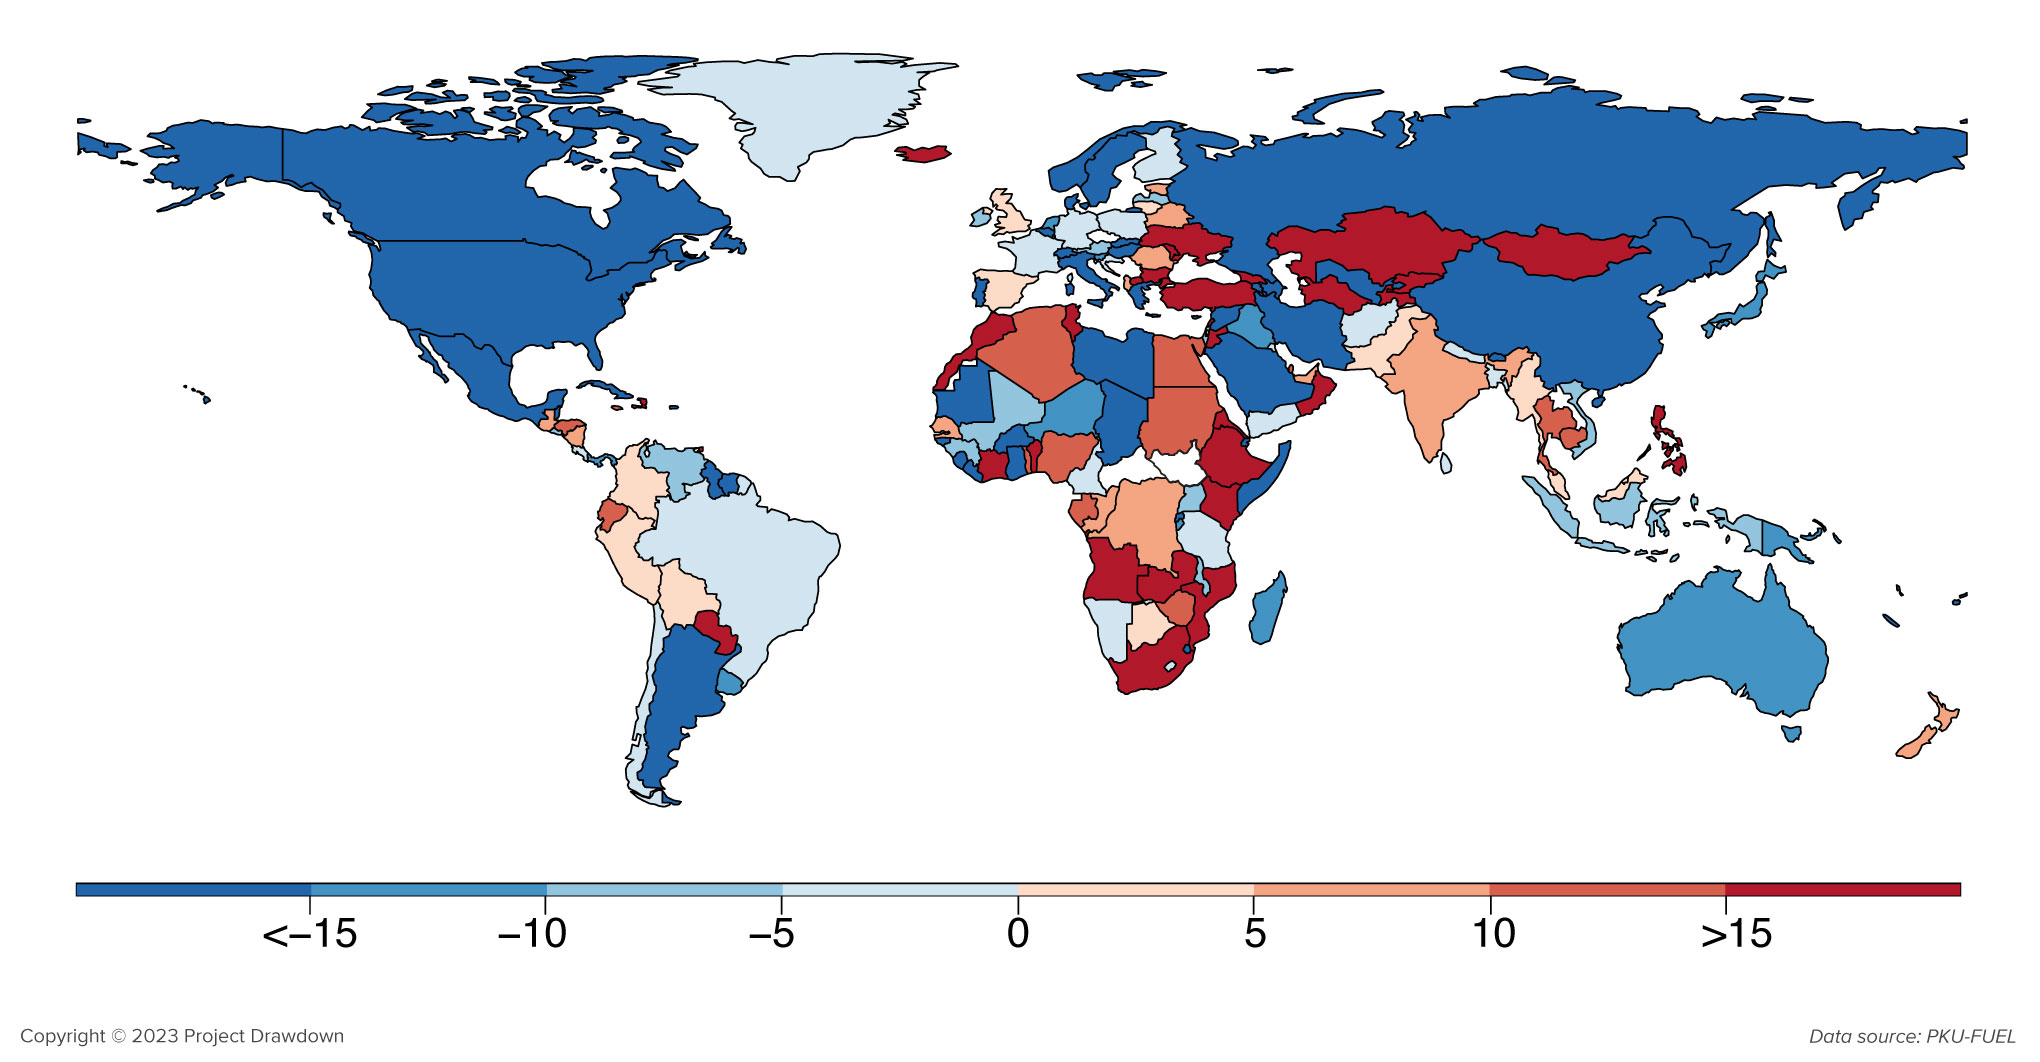
BC emissions across some low-and middle-income countries including Mexico, Algeria, Chad, Chile, and Mauritania also declined by more than 15% over the study period. Notably, Mexico and Chile are two of the few countries that have included reducing BC emissions in their Nationally Determined Contributions (NDC) report, which outlines how each individual country plans to address climate change under the Paris Climate Agreement.
Unfortunately, these declines in BC have been tempered by increases in emissions in countries throughout Africa, South Asia, Eastern Europe, and Central Asia. In South Asia and sub-Saharan Africa, which together account for 38% of total BC emissions, emissions increased by 8% between 2010 and 2017, mostly due to the consumption of unclean solid fuels for cooking and an increase in transportation. If emissions in these regions continue on a similar trend it will offset the gains made in North America, China, and the European Union making it unlikely that global BC will be significantly reduced by 2030, which is essential for reaching global net zero.
Be a Project Drawdown insider!
Sign up for our newsletter today.
While Eastern Europe and Central Asia account for only 4% of global BC emissions, this region experienced an increase of 15% over the study period mostly stemming from the transportation and industry sectors. This is not surprising given that the average age of vehicles – older vehicles tend to be more polluting – is higher in these regions. For example, in all of Eastern Europe and in the Central Asian country of Kyrgyzstan the average car is more than 15 years old. By comparison, the average age of vehicles in Germany and China are 10 and 5 years, respectively.
Based on recent trends, such as the widespread adoption of electric and hybrid vehicles as well as the replacement of gas-powered residential heaters with electric heat pumps, it is likely that BC emissions in the European Union, North America, and China have continued to decline between 2017 and 2023.
However, BC emissions could still be on the rise in South Asia and sub-Saharan Africa. According to one study, global access to clean cooking fuels increased by a paltry 2% between 2015 to 2020, and the latest assessment by the Sustainable Development Solutions Network reveals that growth has been stagnant in sub-Saharan Africa. Meanwhile, transportation is growing rapidly in many places. This suggests that a decline in BC emissions between 2017 and 2023 is unlikely.
Section Number
2.0
Social Share Image media