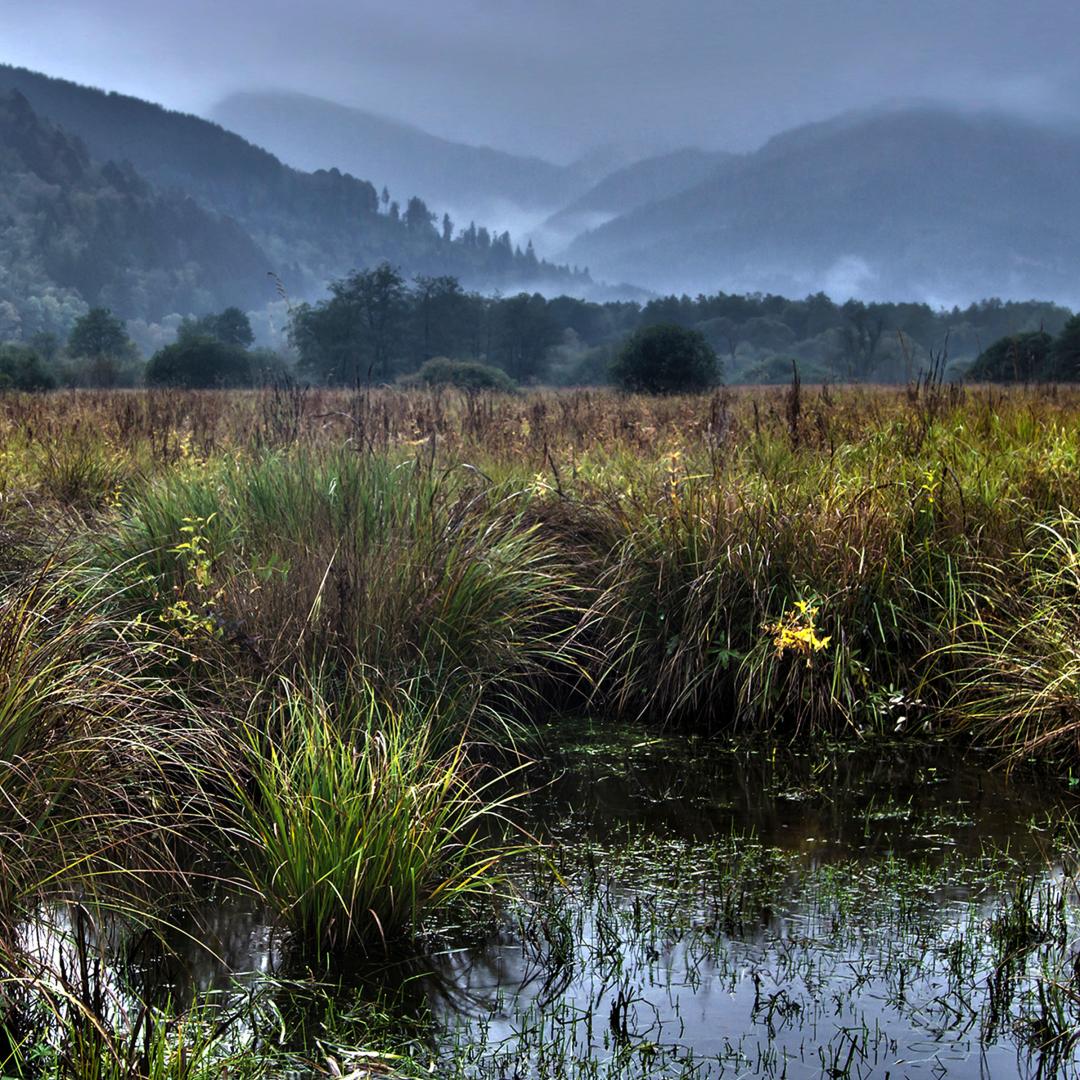
Peatlands are diverse ecosystems characterized by waterlogged, carbon-rich peat soils consisting of partially decomposed dead plant material (Figure 1). They are degraded or destroyed through clearing of vegetation and drainage for agriculture, forestry, peat extraction, or other development. An estimated 600 Gt carbon (~2,200 Gt CO₂‑eq ) is stored in peatlands, twice as much as the carbon stock in all forest biomass (Yu et al., 2010; Pan et al., 2024). Because decomposition occurs very slowly under waterlogged conditions, large amounts of plant material have accumulated in a partially decomposed state over millennia. These carbon-rich ecosystems occupy only 3–4% of land area (Xu et al., 2018b; United Nations Environment Programme [UNEP], 2022). Their protection is both feasible due to their small area and highly impactful due to their carbon density.
Protect Peatlands
The Protect Peatlands solution is defined as legally protecting peatland ecosystems through establishment of protected areas (PAs), which preserves stored carbon and ensures continued carbon sequestration by reducing degradation of the natural hydrology, soils, and/or vegetation. This solution focuses on non-coastal peatlands that have not yet been drained or otherwise severely degraded. Reducing emissions from degraded peatlands is addressed in the Restore Peatlands solution, and mangroves located on peat soils are addressed in the Protect Coastal Wetlands solution.
Solution Basics
ha protected
Climate Impact
CO₂ , CH₄, N₂O
Solution Basics
ha protected
Climate Impact
CO₂ , CH₄, N₂O
Solution Basics
ha protected
Climate Impact
CO₂ , CH₄, N₂O
Solution Basics
ha protected
Climate Impact
CO₂ , CH₄, N₂O
Additional Benefits
Overview
Figure 1. These photos show the diversity of peatlands that occur in different places, including a fen peatland and meadow complex in California (top left), a peat swamp in Indonesia (top right), a peat fen and forest in Canada (bottom left), and a peat bog in New Hampshire (bottom right).
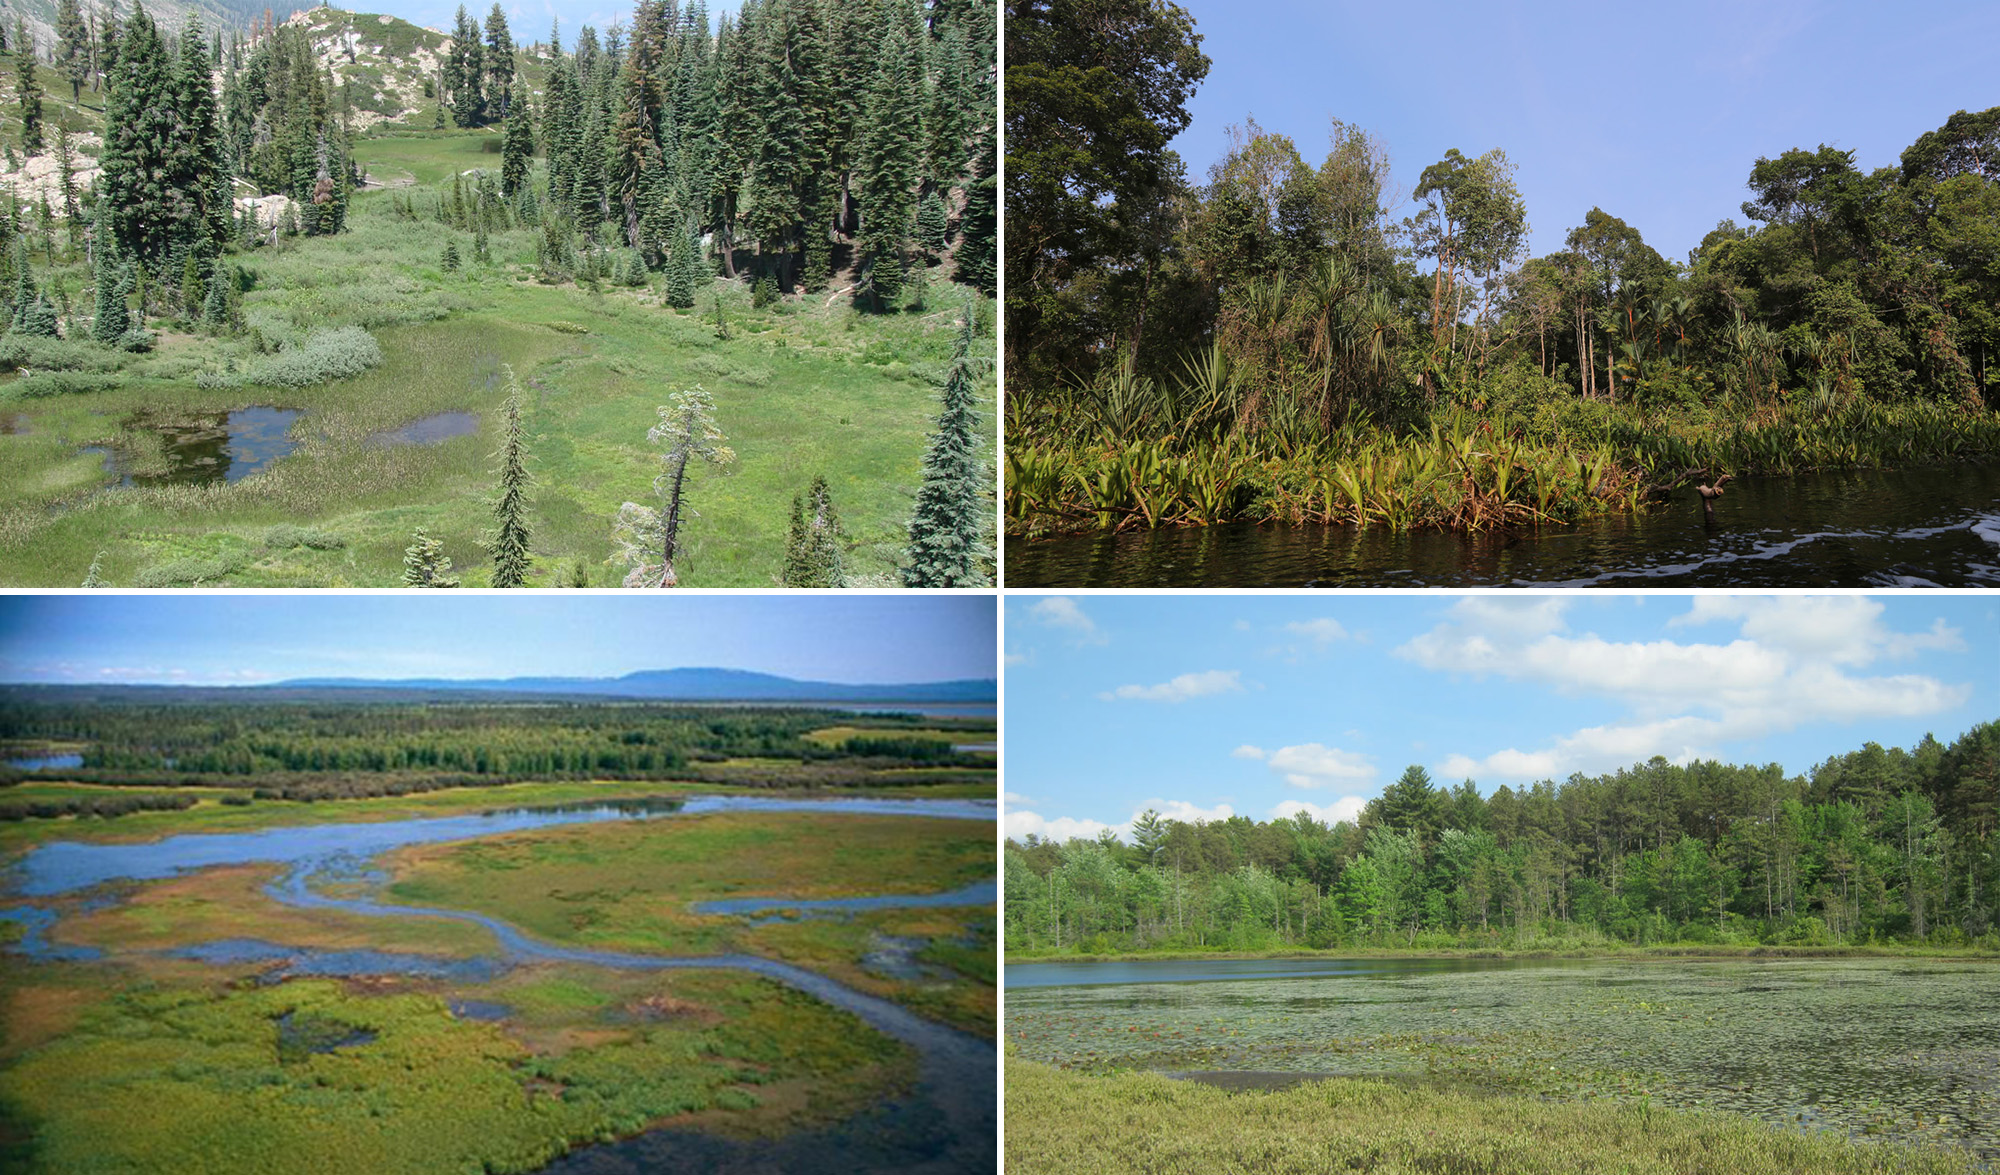
Photo credits: Catie and Jim Bishop | U.S. Department of Agriculture; Rhett A. Butler; Garth Lenz; Linnea Hanson | U.S. Department of Agriculture
When peatlands are drained or disturbed, the rate of carbon loss increases sharply as the accumulated organic matter begins decomposing (Figure 2). Removal of overlying vegetation produces additional GHG emissions while also slowing or stopping carbon uptake. Whereas emissions from vegetation removal occur rapidly following disturbance, peat decomposition and associated emissions can continue for centuries depending on environmental conditions and peat thickness. Peat decomposition after disturbance occurs faster in warmer climates because cold temperatures slow microbial activity. In this analysis, we evaluated tropical, subtropical, temperate, and boreal regions separately.
Figure 2. Greenhouse gas emissions and sequestration in intact peatlands (left) and a drained peatland (right). Intact peatlands are a net greenhouse gas sink, sequestering carbon in peat through photosynthesis but also emitting methane due to waterlogged soils. Drained peatlands are a greenhouse gas source, producing emissions from peat decomposition and drainage canals. Modified from IUCN UK Peatland Programme (2024).
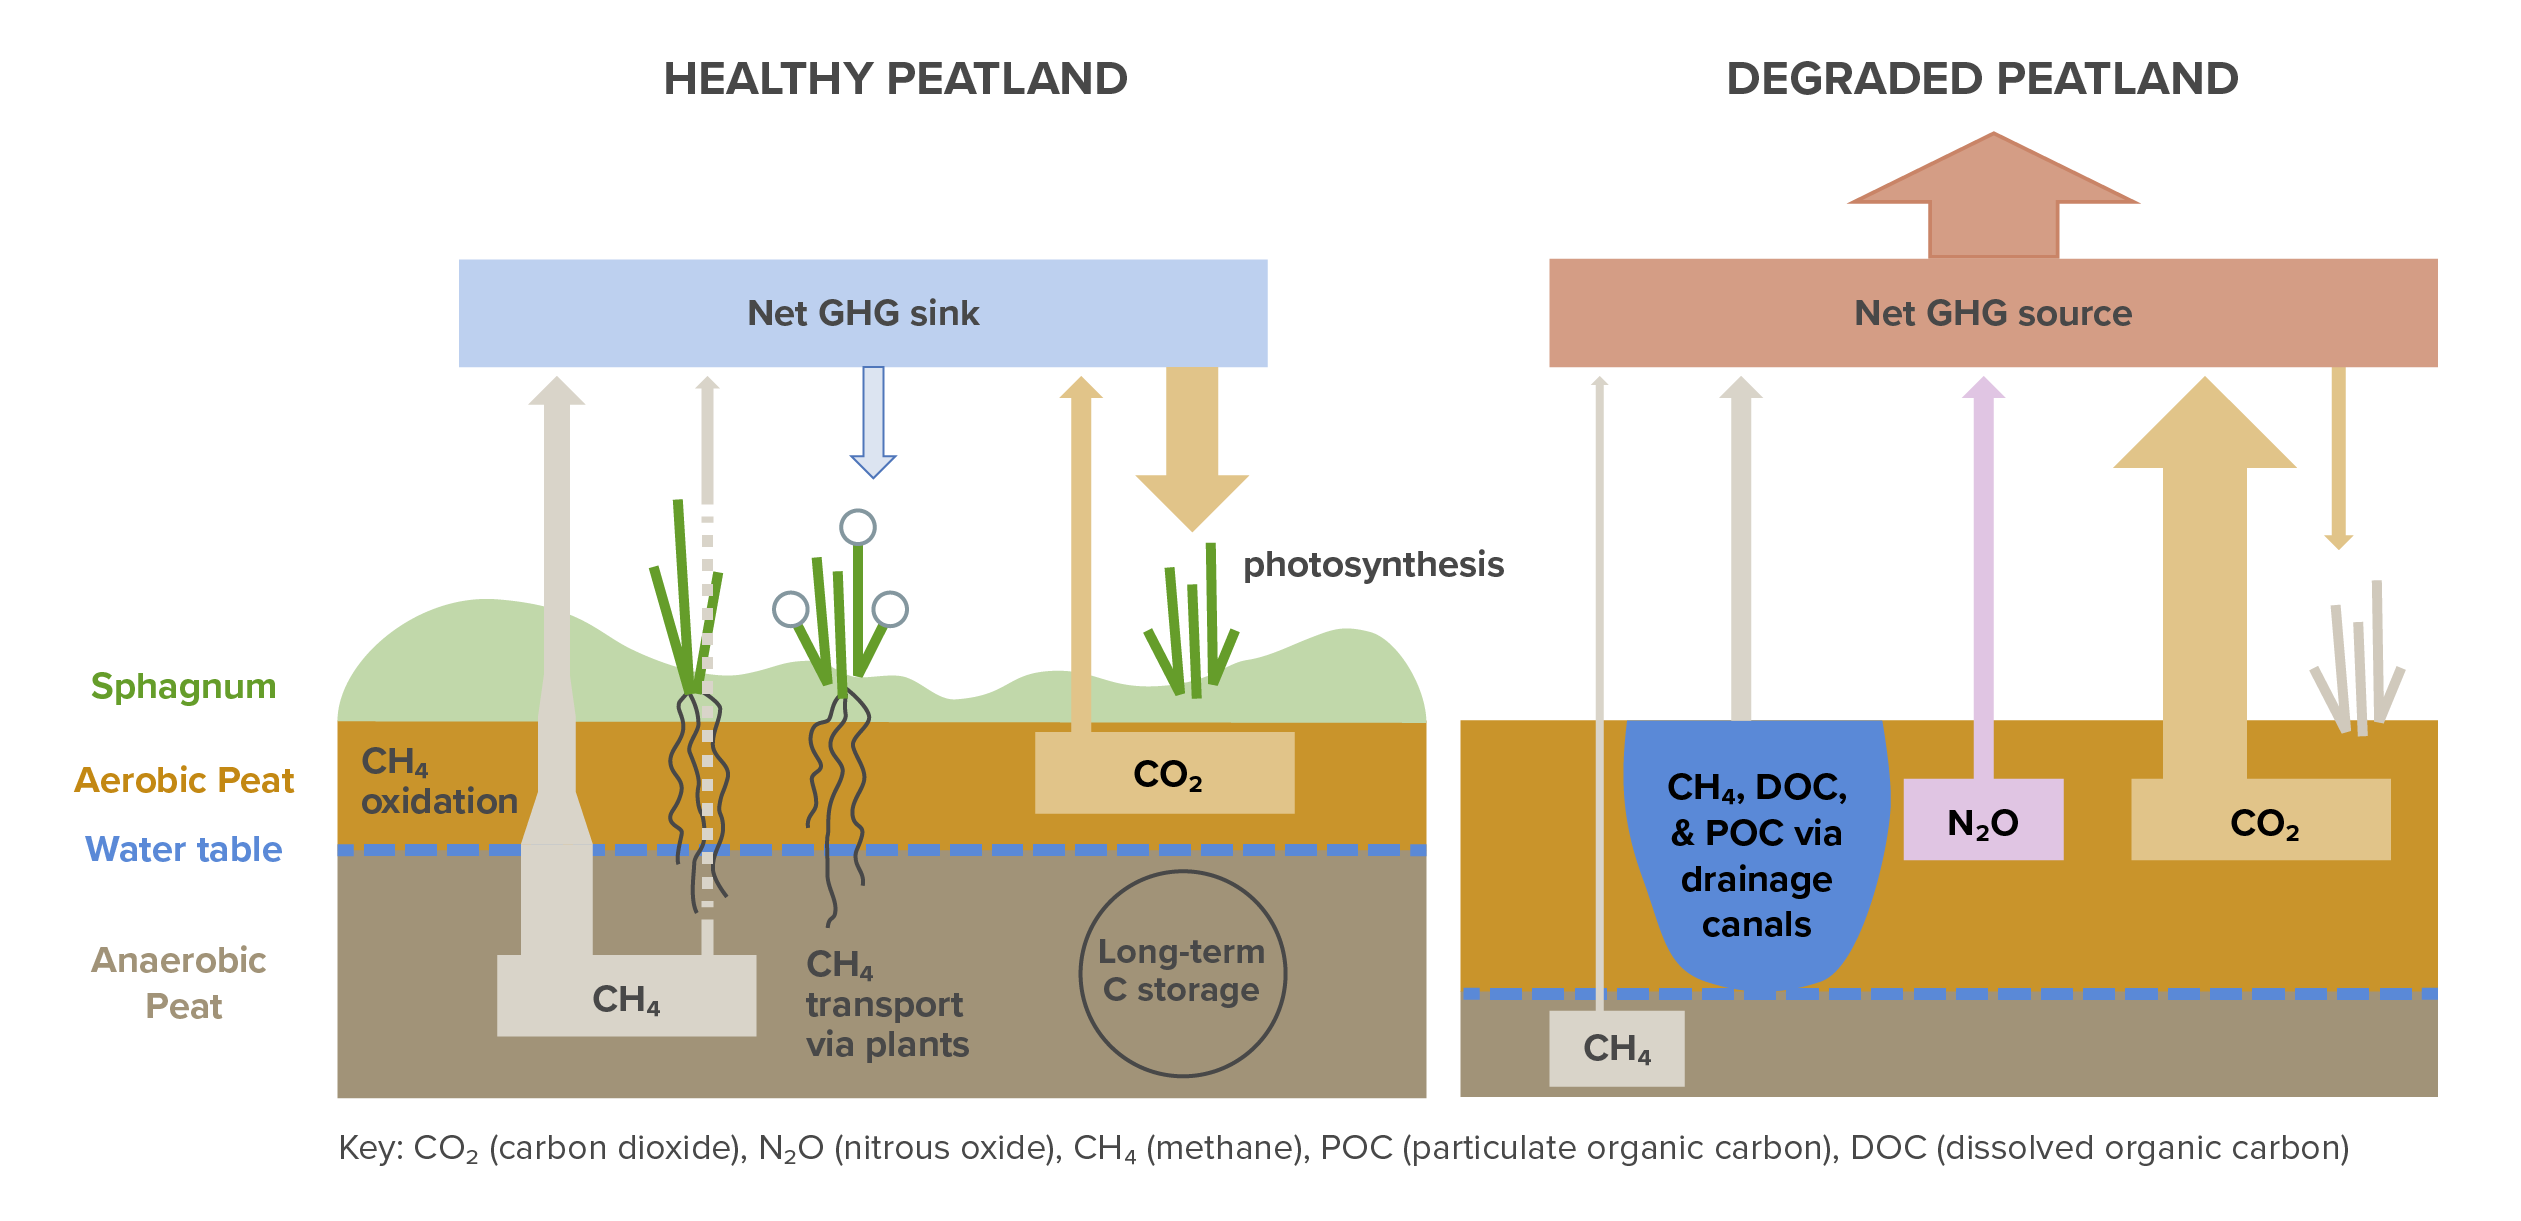
Source: IUCN UK Peatland Programme. (2024, July 10). New briefing addresses the peatlands and methane debate.
In addition to peat decomposition, biomass removal, and lost carbon sequestration, peatland disturbance impacts methane and nitrous oxide emissions and carbon loss through waterways (Figure 2; Intergovernmental Panel on Climate Change [IPCC] Task Force on National Greenhouse Gas Inventories, 2014; UNEP, 2022). Intact peatlands are a methane source because of methane-producing microbes, which thrive under waterlogged conditions. However, carbon uptake typically outweighs methane emissions. Leifield et al. (2019) found that intact peatlands are a net carbon sink of 0.77 ± 0.15 t CO₂‑eq /ha/yr in temperate and boreal regions and 1.65 ± 0.51 t CO₂‑eq /ha/yr in tropical regions after accounting for methane emissions. Peatland drainage reduces methane emissions from the peatland itself, but the drainage ditches can become potent methane sources (Evans et al., 2015; Peacock et al., 2021). Dissolved and particulate organic carbon also run off through drainage ditches, increasing CO₂ emissions in waterways from microbial activity and abiotic processes. Finally, rates of nitrous oxide emissions increase following drainage as the nitrogen stored in the peat becomes available to microbes.
Patterns of ongoing peatland drainage are poorly understood at the global scale, but rates of ecosystem disturbance are generally lower in PAs and on Indigenous peoples’ lands than outside of them (Li et al., 2024b; Wolf et al., 2021; Sze et al., 2021). The International Union for Conservation of Nature (IUCN) defines six levels of PAs that vary in their allowed uses, ranging from strict wilderness preserves to sustainable use areas that allow for some extraction of natural resources. All PA levels were included in this analysis (UNEP World Conservation Monitoring Center [UNEP-WCMC] and IUCN, 2024). Due to compounding uncertainties in the distributions of peatlands and Indigenous peoples’ lands, which have not yet been comprehensively mapped, and unknown rates of peatland degradation within Indigenous people’s lands, peatlands within Indigenous peoples’ lands were excluded from the tables but are discussed in the text (Garnett et al., 2018; UNEP-WCMC and IUCN, 2024).
Impact Calculator
Effectiveness
Adoption
Climate Impact
Effectiveness
Adoption
Climate Impact
Effectiveness
Adoption
Climate Impact
Effectiveness
Adoption
Climate Impact
The Details
Current State
Effectiveness
We estimated that protecting a ha of peatland avoids 0.92–13.47 t CO₂‑eq /ha/yr, with substantially higher emissions reductions in subtropical and tropical regions and lower emissions reductions in boreal regions (100-yr GWP; Table 1a–d; Appendix).
We estimated effectiveness as the avoided emissions attributable to the reduction in peatland loss conferred by protection (Equation 1). First, we calculated the biome-specific difference between the annual rate of peatland loss outside PAs (Peatland lossbaseline) versus inside PAs (Peatland lossprotected) (Appendix; Conchedda & Tubellio, 2020; Davidson et al., 2014; Miettinen et al., 2011; Miettinen et al., 2016; Uda et al., 2017, Wolf et al., 2021). We then multiplied the avoided peatland loss by the total emissions from one ha of drained peatland over 30 years. This is the sum of the total biomass carbon stock (Carbonbiomass), which degrades relatively quickly; 30 years of annual emissions from peat itself (Carbonflux); and 30 years of lost carbon sequestration potential, reflecting the carbon that would have been taken up by one ha of intact peatland in the absence of degradation (Carbonuptake) (IPCC Task Force on National Greenhouse Gas Inventories, 2014; UNEP, 2022). The carbon flux includes CO₂‑eq emissions from: 1) peat oxidation, 2) dissolved organic carbon loss through drainage, 3) the net change in on-field methane between undrained and drained states, 4) methane emissions from drainage ditches, and 5) on-field nitrous oxide emissions.
Equation 1.
Without rewetting, peat loss typically persists beyond 30 years and can continue for centuries (Leifield & Menichetti, 2018). Thus, this is a conservative estimate of peatland protection effectiveness that captures near-term impacts, aligns with the 30-yr cost amortization time frame, and is roughly consistent with commonly used 2050 targets. Using a longer time frame produces larger estimates of emissions from degraded peatlands and therefore higher effectiveness of peatland protection.
The effectiveness of peatland protection as defined here reflects only a small percentage of the carbon stored in peatlands because we account for the likelihood that the peatland would be destroyed without protection. Peatland protection is particularly impactful for peatlands at high risk of drainage.
Table 1. Effectiveness of peatland protection at avoiding emissions and sequestering carbon. Regional differences in values are driven by variation in emissions factors and baseline rates of peatland drainage.
Unit: t CO₂‑eq , 100-yr basis/ha of peatland protected/yr
| Estimate | 0.92 |
Unit: t CO₂‑eq , 100-yr basis/ha of peatland protected/yr
| Estimate | 4.42 |
Unit: t CO₂‑eq , 100-yr basis/ha of peatland protected/yr
| Estimate | 13.47 |
Unit: t CO₂‑eq , 100-yr basis/ha of peatland protected/yr
| Estimate | 13.23 |
Cost
We estimated that the net cost of peatland protection is approximately US$1.5/ha/yr, or $0.25/t CO₂‑eq avoided (Table 2). Data related to the costs of peatland protection are very limited. These estimates reflect global averages rather than regionally specific values, and rarely include data specific to peatlands. The costs of peatland protection include up-front costs of land acquisition and ongoing costs of management and enforcement. The market price of land reflects the opportunity cost of not using the land for other purposes, such as agriculture, forestry, peat extraction, or urban development. Protecting peatlands can also generate revenue through increased tourism. Costs and revenues are highly variable across regions, depending on the costs of land and enforcement and potential for tourism.
Dienerstein et al. (2024) estimated the initial cost of establishing a protected area for 60 high-biodiversity ecoregions. Amongst the 33 regions that were likely to contain peatlands, the median acquisition cost was US$957/ha, which we amortized over 30 years. Costs of protected area maintenance were estimated at US$9–17/ha/yr (Bruner et al., 2004; Waldron et al., 2020), though these estimates were not specific to peatlands. Additionally, these estimates reflect the costs of effective enforcement and management, but many existing protected areas lack adequate funds for effective enforcement (Adams et al., 2019; Barnes et al., 2018; Burner et al., 2004). Waldron et al. (2020) estimated that, across all ecosystems, tourism revenues directly attributable to protected area establishment were US$43/ha/yr, not including downstream revenues from industries that benefit from increased tourism. Inclusion of a tourism multiplier would substantially increase the estimated economic benefits of peatland protection.
Table 2. Cost per unit climate impact for peatland protection.
Unit: 2023 US$/t CO₂‑eq , 100-yr basis
| Median | 0.25 |
Learning Curve
A learning curve is defined here as falling costs with increased adoption. The costs of peatland protection do not fall with increasing adoption, so there is no learning curve for this solution.
Speed of Action
Speed of action refers to how quickly a climate solution physically affects the atmosphere after it is deployed. This is different from speed of deployment, which is the pace at which solutions are adopted.
At Project Drawdown, we define the speed of action for each climate solution as gradual, emergency brake, or delayed.
Protect Peatlands is an EMERGENCY BRAKE climate solution. It has the potential to deliver a more rapid impact than gradual and delayed solutions. Because emergency brake solutions can deliver their climate benefits quickly, they can help accelerate our efforts to address dangerous levels of climate change. For this reason, they are a high priority.
Adoption
Current Adoption
Because peatlands are characterized by their soils rather than by overlying vegetation, they are difficult to map at the global scale (Minasny et al., 2024). Mapping peatlands remains an active area of research, and the adoption values presented here are uncertain. We estimated that 22.6 Mha of peatlands are located within strictly protected PAs (IUCN classes I or II), and 82.3 Mha are within other or unknown PA classes (Table 3a–e; UNEP, 2022; UNEP-WCMC & IUCN, 2024), representing 22% of total global peatland area (482 Mha). Because of data limitations, we did not include Indigenous peoples’ lands in subsequent analyses despite their conservation benefits. There are an additional 186 Mha of peatlands within Indigenous peoples’ lands that are not classified as PAs, with a large majority (155 Mha) located in boreal regions (Table 3; Garnett et al., 2018; UNEP, 2022).
Given the uncertainty in the global extent of peatlands, estimates of peatland protection vary. The Global Peatlands Assessment estimated that 19% (90.7 Mha) of peatlands are protected (UNEP, 2022), with large regional variations ranging from 35% of peatlands protected in Africa to only 10% in Asia. Using a peatland map from Melton et al. (2022), Austin et al. (2025) estimated that 17% of global peatlands are within PAs, and an additional 27% are located in Indigenous peoples’ lands (excluding Indigenous peoples’ lands in Canada covering large peatland areas).
Table 3. Current peatland area under protection by biome (circa 2023). Estimates are provided for two different forms of protection: “strict” protection, including IUCN classes I and II, and “nonstrict” protection, including all other IUCN classes. Regional values may not sum to global totals due to rounding.
Unit: Mha protected
| Area within strict PAs | 12.4 |
| Area within non-strict PAs | 41.7 |
Unit: Mha protected
| Area within strict PAs | 3.0 |
| Area within non-strict PAs | 10.1 |
Unit: Mha protected
| Area within strict PAs | 1.1 |
| Area within non-strict PAs | 1.6 |
Unit: Mha protected
| Area within strict PAs | 6.1 |
| Area within non-strict PAs | 28.9 |
Unit: Mha protected
| Area within strict PAs | 22.6 |
| Area within non-strict PAs | 82.3 |
Adoption Trend
We calculated the annual rate of new peatland protection based on the year of PA establishment for areas established in 2000–2020. The median annual increase in peatland protection was 0.86 Mha (mean 2.0 Mha; Table 4a–d). This represents a roughly 0.8%/yr increase in peatlands within PAs, or protection of an additional 0.2%/yr of total global peatlands. This suggests that peatland protection is likely occurring at a somewhat slower rate than peatland degradation – which is estimated to be around 0.5% annually at the global scale – though this estimate is highly uncertain and spatially variable (Davidson et al., 2014).
There were large year-to-year differences in how much new peatland area was protected over this period, ranging from only 0.2 Mha in 2016 to 7.9 Mha in 2007. The rate at which peatland protection is increasing has been decreasing, with a median increase of 1.7 Mha/yr between 2000 and 2010 declining to 0.7 Mha/yr during 2010–2020. Recent median adoption of peatland protection by area is highest in boreal (0.5 Mha/yr, Table 4a) and tropical regions (0.2 Mha/yr, Table 4d), followed by temperate regions (0.1 Mha/yr, Table 4b) and subtropical regions (0.01 Mha/yr, Table 4c) (2010–2020). Scaled by total peatland area, however, recent rates of peatland protection are lowest in the subtropics (0.04%/yr), followed by the boreal (0.14%/yr), the tropics (0.16%/yr), and temperate regions (0.19%/yr).
Table 4. Adoption trend for peatland protection in PAs of any IUCN class (2000–2020). The 25th and 75th percentiles reflect only interannual variance.
Unit: Mha of peatland protected/yr
| 25th percentile | 0.24 |
| Mean | 0.87 |
| Median (50th percentile) | 0.50 |
| 75th percentile | 0.89 |
Unit: Mha of peatland protected/yr
| 25th percentile | 0.07 |
| Mean | 0.23 |
| Median (50th percentile) | 0.10 |
| 75th percentile | 0.28 |
Unit: Mha of peatland protected/yr
| 25th percentile | 0.00 |
| Mean | 0.04 |
| Median (50th percentile) | 0.01 |
| 75th percentile | 0.04 |
Unit: Mha of peatland protected/yr
| 25th percentile | 0.05 |
| Mean | 0.84 |
| Median (50th percentile) | 0.25 |
| 75th percentile | 0.83 |
Adoption Ceiling
We considered the adoption ceiling to include all undrained, non-coastal peatlands and estimated this to be 425 Mha, based on the Global Peatlands Database and Global Peatlands Map (UNEP, 2022; Table 5e; Appendix). We estimated that 284 Mha of undrained peatlands remain in boreal regions (Table 5a), 26 Mha in temperate regions (Table 5b), 12 Mha in the subtropics (Table 5c), and 103 Mha in the tropics (Table 5d). The adoption ceiling represents the technical upper limit to adoption of this solution.
There is substantial uncertainty in the global extent of peatlands, which is not quantified in these adoption ceiling values. Estimates of global peatland extent from recent literature include 404 Mha (Melton et al., 2022), 423 Mha (Xu et al., 2018b), 437 Mha (Müller & Joos, 2021), 463 Mha (Leifield & Menichetti, 2018), and 488 Mha (UNEP, 2022). Several studies suggest that the global peatland area may still be underestimated (Minasny et al., 2024; UNEP, 2022).
Table 5. Adoption ceiling: upper limit for adoption of legal protection of peatlands by biome. Values may not sum to global totals due to rounding.
Unit: Mha protected
| Peatland area (Mha) | 284 |
Unit: Mha protected
| Peatland area (Mha) | 26 |
Unit: Mha protected
| Peatland area (Mha) | 12 |
Unit: Mha protected
| Peatland area (Mha) | 103 |
Unit: Mha protected
| Peatland area (Mha) | 425 |
Achievable Adoption
UNEP (2022) places a high priority on protecting a large majority of remaining peatlands for both climate and conservation objectives. We defined the achievable range for peatland protection as 70% (low achievable) to 90% (high achievable) of remaining undrained peatlands. Only ~19% of peatlands are currently under formal protection within PAs (UNEP, 2022; UNEP-WCMC and IUCN, 2024). However, approximately 60% of undrained peatlands are under some form of protection if peatlands within Indigenous peoples’ lands are considered (Garnett et al., 2018; UNEP, 2022; UNEP-WCMC and IUCN, 2024). While ambitious, this provides support for our selected achievable range of 70–90% (Table 6a-e).
Ensuring effective and durable protection of these peatlands from drainage and degradation, including secure land tenure for Indigenous peoples who steward peatlands and other critical ecosystems, is a critical first step. Research suggests that local community leadership, equitable stakeholder engagement, and cross-scalar governance are needed to achieve conservation goals while also balancing social and economic outcomes through sustainable use (Atkinson & Alibašić, 2023; Cadillo & Bennett, 2024; Girkin et al., 2023; Harrison et al., 2019; Suwarno et al., 2015). Sustainable uses of peatlands include some forms of paludiculture, which can involve peatland plant cultivation, fishing, or gathering without disturbance of the hydrology or peat layer (Tan et al., 2021).
Table 6. Range of achievable adoption of peatland protection by biome.
Unit: Mha protected
| Current adoption | 54 |
| Achievable – low | 199 |
| Achievable – high | 255 |
| Adoption ceiling | 284 |
Unit: Mha protected
| Current adoption | 13 |
| Achievable – low | 18 |
| Achievable – high | 24 |
| Adoption ceiling | 26 |
Unit: Mha protected
| Current adoption | 3 |
| Achievable – low | 9 |
| Achievable – high | 11 |
| Adoption ceiling | 12 |
Unit: Mha protected
| Current adoption | 35 |
| Achievable – low | 72 |
| Achievable – high | 92 |
| Adoption ceiling | 103 |
Unit: Mha protected
| Current adoption | 105 |
| Achievable – low | 297 |
| Achievable – high | 382 |
| Adoption ceiling | 425 |
Impacts
Climate Impact
We estimated that PAs currently reduce emissions from peatland degradation by 0.6 Gt CO₂‑eq/yr (Table 7a-e). Achievable levels of peatland protection have the potential to reduce emissions 1.3–1.7 Gt CO₂‑eq/yr, with a technical upper bound of 1.9 Gt CO₂‑eq/yr. The estimate of climate impacts under current adoption does not include the large areas of peatlands protected by Indigenous peoples but not legally recognized as PAs. Inclusion of these areas would increase the current estimated impact of peatland protection to 0.9 Gt CO₂‑eq/yr.
Other published estimates of additional emissions reductions through peatland protection are somewhat lower, with confidence intervals of 0–1.2 Gt CO₂‑eq/yr (Griscom et al., 2017; Humpenöder et al., 2020; Loisel et al., 2021; Strack et al., 2022). These studies vary in their underlying methodology and data, including the extent of peatland, the baseline rate of peatland loss, the potential for protected area expansion, which GHGs are considered, the time frame over which emissions are calculated, and whether they account for vegetation carbon loss or just emissions from the peat itself.
Table 7. Climate impact at different levels of adoption.
Unit: Gt CO₂ ‑eq/yr, 100-yr basis
| Current adoption | 0.05 |
| Achievable – low | 0.18 |
| Achievable – high | 0.24 |
| Adoption ceiling | 0.26 |
Unit: Gt CO₂ ‑eq/yr, 100-yr basis
| Current adoption | 0.06 |
| Achievable – low | 0.08 |
| Achievable – high | 0.11 |
| Adoption ceiling | 0.12 |
Unit: Gt CO₂ ‑eq/yr, 100-yr basis
| Current adoption | 0.04 |
| Achievable – low | 0.12 |
| Achievable – high | 0.15 |
| Adoption ceiling | 0.17 |
Unit: Gt CO₂ ‑eq/yr, 100-yr basis
| Current adoption | 0.46 |
| Achievable – low | 0.95 |
| Achievable – high | 1.22 |
| Adoption ceiling | 1.36 |
Unit: Gt CO₂ ‑eq/yr, 100-yr basis
| Current adoption | 0.61 |
| Achievable – low | 1.33 |
| Achievable – high | 1.71 |
| Adoption ceiling | 1.90 |
Additional Benefits
Extreme Weather Events
Peatland protection can help communities adapt to extreme weather. Because peatlands regulate water flows, they can reduce the risk of droughts and floods (IUCN, 2021; Ritson et al., 2016). Evidence suggests that peatlands can provide a cooling effect to the immediate environment, lowering daytime temperatures and reducing temperature extremes between day and night (Dietrich & Behrendt, 2022; Helbig et al., 2020; Worrall et al., 2022).
Health
When peatlands are drained they are susceptible to fire. Peatland fires can significantly contribute to air pollution because of the way these fires smolder (Uda et al., 2019). Smoke and pollutants, particularly PM2.5, from peatland fires can harm respiratory health and lead to premature mortality (Marlier et al., 2019). A study of peatland fires in Indonesia estimated they contribute to the premature mortality of about 33,100 adults and about 2,900 infants annually (Hein et al., 2022). Researchers have linked exposure to PM2.5 from peatland fires to increased hospitalizations, asthma, and lost workdays (Hein et al., 2022). Peatland protection mitigates exposure to air pollution and can save money from reduced health-care expenditures (Kiely et al., 2021).
Income and Work
Peatlands support the livelihoods of nearby communities, especially those in low- and middle-income countries. In the peatlands of the Amazon and Congo basins, fishing livelihoods depend on aquatic wildlife (Thornton et al., 2020). Peatlands in the Peruvian Amazon provide important goods for trade, such as palm fruit and timber, and are used for hunting by nearby populations (Schulz et al., 2019). Peatlands can also support the livelihoods of women and contribute to gender equality. For example, raw materials – purun – from Indonesian peatlands are used by women to create and sell mats used in significant events such as births, weddings, and burials (Goib et al., 2018).
Nature Protection
Peatlands are home to a wide range of species, supporting biodiversity of flora and an abundance of wildlife (UNEP, 2022; Minayeva et al., 2017; Posa et al., 2011). Because of their unique ecosystem, peatlands provide a habitat for many rare and threatened species (Posa et al., 2011). A study of Indonesian peat swamps found that the IUCN Red List classified approximately 45% of mammals and 33% of birds living in these ecosystems as threatened, vulnerable, or endangered (Posa et al., 2011). Peatlands also support a variety of insect species (Spitzer & Danks, 2006). Because of their sensitivity to environmental changes, some peatland insects can act as indicators of peatland health and play a role in conservation efforts (Spitzer & Danks, 2006).
Water Resources
Peatlands can filter water pollutants and improve water quality and are important sources of potable water for some populations (Minayeva et al., 2017). Xu et al. (2018a) estimated that peatlands store about 10% of freshwater globally, not including glacial water. Peatlands are a significant drinking water source for people in the United Kingdom and Ireland, where they provide potable water for about 71.4 million people (Xu et al., 2018a).
Water Quality
See Water Resources section above.
Other
Caveats
Permanence, or the durability of stored carbon, is a caveat for emissions avoidance through peatland protection that is not addressed in this analysis. Protected peatlands could be drained if legal protections are reversed or inadequately enforced, resulting in the loss of stored carbon. Additionally, fires on peatlands have become more frequent due to climate change (Turetsky et al., 2015; Loisel et al., 2021), and can produce very large emissions pulses (Konecny et al., 2016; Nelson et al., 2021). In boreal regions, permafrost thaw can trigger large, sustained carbon losses from previously frozen peat (Hugelius et al., 2020; Jones et al., 2017). In tropical regions, climate change-induced changes in precipitation can lower water tables in intact peatlands, increasing risks of peat loss and reducing sequestration potential (Deshmukh et al., 2021).
Additionality, or the degree to which emissions reductions are above and beyond a baseline, is another important caveat for emissions avoidance through ecosystem protection (Atkinson & Alibašić, 2023; Fuller et al., 2020; Williams et al., 2023). In this analysis, additionality was addressed by using baseline rates of peatland degradation in calculating effectiveness. Evaluating additionality is challenging and remains an active area of research.
Finally, there are substantial uncertainties in the available data on peatland areas and distributions, peatland loss rates, the drivers of peatland loss, the extent and boundaries of PAs, and the efficacy of PAs at reducing peatland disturbance. Emissions dynamics on both intact and cleared peatlands are also uncertain, particularly under different land management practices and in the context of climate change.
Risks
Leakage occurs when peatland drainage and clearing moves outside of protected area boundaries and is a risk of relying on peatland protection as an emissions reduction strategy (Harrison & Paoli, 2012; Strack et al., 2022). If the relocated clearing also occurs on peat soils, emissions from peatland drainage and degradation are relocated but not actually reduced. If disturbance is relocated to mineral soils, however, the disturbance-related emissions will typically be lower. Combining peatland protection with policies to reduce incentives for peatland clearing can help avoid leakage.
Peatland protection must be driven by or conducted in close collaboration with local communities, which often depend on peatlands for their livelihoods and economic advancement (Jalilov et al., 2025; Li et al., 2024a; Suwarno et al., 2016). Failure to include local communities in conservation efforts violates community sovereignty and can exacerbate existing socioeconomic inequities (Felipe Cadillo & Bennet, 2024; Thorburn & Kull, 2015). Effective peatland protection requires development of alternative income opportunities for communities currently dependent on peatland drainage, such as tourism; sustainable peatland use practices like paludiculture; or compensation for ecosystem service provisioning, including carbon storage (Evers et al., 2017; Girkin et al., 2023; Suwarno et al., 2016; Syahza et al., 2020; Tan et al., 2021; Uda et al., 2017).
Trade-offs
None
Interactions with Other Solutions
Reinforcing
Protected areas often include multiple ecosystems. Peatland protection will likely lead to protection of other ecosystems within the same areas, and the health of nearby ecosystems is improved by the services provided by intact peatlands.
Restored peatlands need protection to reduce the risk of future disturbance, and the health of protected peatlands can be improved through restoration of adjacent degraded peatlands.
Competing
Protecting peatlands could limit land availability for renewable energy technologies and raw material and food production. Protect Peatlands competes with the following solutions for land.
Evidence Base
Consensus of effectiveness in reducing emissions and maintaining carbon removal: High
There is high scientific consensus that protecting peatland carbon stocks is a critical component of mitigating climate change (Girkin & Davidson, 2024; Harris et al., 2022; Leifield et al., 2019; Noon et al., 2022; Strack et al., 2022). Globally, an estimated 11–12% of peatlands have been drained for uses such as agriculture, forestry, and harvesting of peat for horticulture and fuel, with much more extensive degradation in temperate and tropical regions (~45%) than in boreal regions (~4%) (Fluet-Chouinard et al., 2023; Leifield & Menichetti, 2018; UNEP, 2022). Rates of peatland degradation are highly uncertain, and the effectiveness of PAs at reducing drainage remains unquantified. In lieu of peatland-specific data on the effectiveness of PAs at reducing drainage, we used estimates from Wolf et al. (2021), who found that PAs reduce forest loss by approximately 40.5% at the global average.
Carbon stored in peatlands has been characterized as “irrecoverable carbon” because it takes centuries to millennia to accumulate and could not be rapidly recovered if lost (Goldstein et al., 2020; Noon et al., 2021). Degraded peatlands currently emit an estimated 1.3–1.9 Gt CO₂‑eq/yr (excluding fires), equal to ~2–4% of total global emissions (Leifield and Menichetti., 2018; UNEP, 2022). Leifield et al. (2019) projected that without protection or restoration measures, emissions from drained peatlands could produce enough emissions to consume 10–41% of the remaining emissions budget for keeping warming below 1.5–2.0 °C. Peatland drainage had produced a cumulative 80 Gt CO₂‑eq by 2015, equal to nearly two years worth of total global emissions. In a modeling study, Humpenöder et al. (2020) projected that an additional 10.3 Mha of peatlands would be degraded by 2100 in the absence of new protection efforts, increasing annual emissions from degraded peatlands by ~25% (an additional 0.42 Gt CO₂‑eq/yr in their study).
The results presented in this document synthesize findings from 11 global datasets, supplemented by four regional studies on peatland loss rates in Southeast Asia. We recognize that geographic bias in the information underlying global data products creates bias, and hope this work inspires research and data sharing on this topic in underrepresented regions.
Take Action
Looking to get involved? Below are some key actions for this solution that can get you started, arranged according to different roles you may play in your professional or personal life.
These actions are meant to be starting points for involvement and are not intended to be prescriptive or necessarily suggest they are the most important or impactful actions to take. We encourage you to explore and get creative!
Lawmakers and Policymakers
- Set clear designations of remaining peatlands and implement robust monitoring and enforcement methods.
- Place bans or regulations on draining intact peatlands, compensate farmers for income losses, and offer extension services that promote protection and paludiculture (growing food on peatlands).
- Grant Indigenous communities full property rights and autonomy and support them in monitoring, managing, and enforcing protected areas.
- Incorporate peatland protection into national climate plans and international commitments.
- Coordinate peatland protection efforts horizontally (e.g., across agencies) and vertically (e.g., across subnational, national, and international efforts), ensuring an inclusive process for local and Indigenous communities.
- Use financial incentives such as subsidies, tax breaks, and payments for ecosystem services (PES) to protect peatlands from development.
- Synthesize water management regulations to ensure local authorities, renters, and landowners coordinate sufficient water levels in peatlands.
- Remove harmful agricultural, logging, and mining subsidies.
- Map and utilize real-time data to monitor the status and condition of peatland areas.
- Invest public funds in peatland conservation, restoration, sustainable management practices, specialized research facilities, and other R&D efforts.
- Invest in fire warning, prevention, and response efforts and establish local volunteer fire prevention groups.
- Work with farmers, civil society, and businesses to develop high-integrity carbon markets for peatlands.
Further information:
- Peatlands and climate change. IUCN (n.d.)
- Best practice book for peatland restoration and climate change mitigation. Pakalne (2021)
- Government relations and public policy job function action guide. Project Drawdown (2022)
- Legal job function action guide. Project Drawdown (2022)
- Global peatlands assessment: the state of the world’s peatlands. UNEP (2022)
Practitioners
- Refrain from draining or developing intact peatlands.
- Invest in peatland conservation, restoration, sustainable management practices, specialized research facilities, and other R&D efforts.
- Participate in stakeholder engagements and assist policymakers in designating peatlands, creating regulations, and implementing robust monitoring and enforcement methods.
- Grant Indigenous communities full property rights and autonomy and support them in monitoring, managing, and enforcing protected areas.
- Ensure protected peatlands don’t displace, violate rights, or reduce access to vital resources for local and Indigenous communities.
- Assist in managing and monitoring protected peatlands, utilizing real-time monitoring and satellite data.
- Create sustainable use regulations for protected peatland areas that provide resources to the local community.
- Conduct proactive land-use planning to avoid infrastructure or development projects that may interfere with protected peatlands or incentivize drainage.
- Create legal grievance processes, dispute resolution mechanisms, and restitution procedures for violations or disagreements over protected peatlands.
- Help shift public narratives to mobilize public action and build political will for protecting peatlands by creating educational campaigns and strengthening networks of stakeholders and rightsholders.
- Take advantage of existing financial incentives such as subsidies, tax breaks, and payments for ecosystem services (PES) to protect peatlands from development.
- Offer or create market mechanisms such as biodiversity offsets, payments for ecosystem services, voluntary high-integrity carbon markets, and debt-for-nature swaps to fund peatland protection.
- Synthesize water management regulations to ensure local authorities, renters, and landowners coordinate sufficient water levels in peatlands.
- Establish coordinating bodies for farmers, landowners, policymakers, and other stakeholders to manage protected areas holistically.
- Invest in fire warning, prevention, and response efforts and establish local volunteer fire prevention groups.
Further information:
- Peatlands and climate change. IUCN (n.d.)
- Best practice book for peatland restoration and climate change mitigation. Pakalne (2021)
- Global peatlands assessment: the state of the world’s peatlands. UNEP (2022)
Business Leaders
- Create peat-free supply chains, utilizing data, information, and the latest technology to inform product sourcing.
- Integrate peat-free business and investment policies and practices in net zero strategies.
- Only purchase carbon credits from high-integrity, verifiable carbon markets and do not use them as replacements for decarbonizing operations.
- Develop financial instruments to invest in peatlands focusing on supporting Indigenous communities.
- Conduct proactive land-use planning to avoid infrastructure or development projects that may interfere with protected peatlands or incentivize drainage.
- Amplify the voices of local communities and civil society to promote robust media coverage.
- Invest in and support Indigenous and local communities' capacity for legal protection and public relations.
- Leverage political influence to advocate for stronger peatland protection policies at national and international levels.
Further information:
- Peatlands and climate change. IUCN (n.d.)
- Best practice book for peatland restoration and climate change mitigation. Pakalne (2021)
- Climate solutions at work. Project Drawdown (2021)
- Drawdown-aligned business framework. Project Drawdown (2021)
- Global peatlands assessment: the state of the world’s peatlands. UNEP (2022)
Nonprofit Leaders
- Ensure operations utilize peat-free products and supply chains.
- Advocate for protecting peatlands and for public investments.
- Assist in managing and monitoring protected peatlands, utilizing real-time monitoring and satellite data.
- Provide financial support for protecting peatlands management, monitoring, and enforcement.
- Assist in conducting proactive land-use planning to avoid infrastructure or development projects that may interfere with protected peatlands or incentivize drainage.
- Advocate for creating legal grievance processes, dispute resolution mechanisms, and restitution procedures for violations or disagreements over protected peatlands.
- Support high-integrity carbon markets, institutions, rules, and norms to cultivate the demand for high-quality carbon credits.
- Share data, information, and investment frameworks that successfully avoid deforestation to support protected peatlands, businesses, and investors.
- Help shift public narratives to mobilize public action and build political will for protecting peatlands by creating educational campaigns and strengthening networks of stakeholders and rightsholders.
- Amplify the voices of local communities and civil society to promote robust media coverage.
- Invest in and support Indigenous and local communities' capacity for legal protection and public relations.
Further information:
- Peatlands and climate change. IUCN (n.d.)
- Best practice book for peatland restoration and climate change mitigation. Pakalne (2021)
- Global peatlands assessment: the state of the world’s peatlands. UNEP (2022)
Investors
- Create peat-free investment portfolios, utilizing data, information, and the latest technology to inform investments.
- Invest in peatland protection, monitoring, management, and enforcement mechanisms.
- Utilize financial mechanisms such biodiversity offsets, payments for ecosystem services, voluntary high-integrity carbon markets, and debt-for-nature swaps to fund peatland protection.
- Invest in and support Indigenous and local communities' capacity for legal protection and public relations.
- Share data, information, and investment frameworks that successfully avoid investments that drive peatland destruction to support peatlands, other investors, and NGOs.
- Help shift public narratives to mobilize public action and build political will for protecting peatlands by creating educational campaigns and strengthening networks of stakeholders and rightsholders.
Further information:
- Peatlands and climate change. IUCN (n.d.)
- Best practice book for peatland restoration and climate change mitigation. Pakalne (2021)
- Global peatlands assessment: the state of the world’s peatlands. UNEP (2022)
Philanthropists and International Aid Agencies
- Ensure operations utilize peat-free products and supply chains.
- Advocate for protecting peatlands and for public investments.
- Provide technical assistance to low- and middle-income countries and communities to protect peatlands.
- Provide financial assistance to low- and middle-income countries and communities for peatland protection.
- Assist in managing and monitoring protected peatlands, utilizing real-time monitoring and satellite data.
- Assist in conducting proactive land-use planning to avoid infrastructure or development projects that may interfere with protected peatlands or incentivize drainage.
- Support and finance high-integrity carbon markets, institutions, rules, and norms to cultivate the demand for high-quality carbon credits.
- Advocate for creating legal grievance processes, dispute resolution mechanisms, and restitution procedures for violations or disagreements over protected peatlands.
- Support peatlands, other investors, and NGOs by sharing data, information, and investment frameworks that successfully avoid financing peatland destruction.
- Help shift public narratives to mobilize public action and build political will for protecting peatlands by creating educational campaigns and strengthening networks of stakeholders and rightsholders.
- Amplify the voices of local communities and civil society to promote robust media coverage.
- Invest in and support Indigenous and local communities' capacity for legal protection and public relations.
- Financially support Indigenous land tenure.
Further information:
- Peatlands and climate change. IUCN (n.d.)
- Best practice book for peatland restoration and climate change mitigation. Pakalne (2021)
- Global peatlands assessment: the state of the world’s peatlands. UNEP (2022)
Thought Leaders
- Advocate for protecting peatlands and for public investments.
- Assist in managing and monitoring protected peatlands, utilizing real-time monitoring and satellite data.
- Assist in conducting proactive land-use planning to avoid infrastructure or development projects that may interfere with protected peatlands or incentivize drainage.
- Provide technical assistance to low- and middle-income countries and communities to protect peatlands.
- Advocate for creating legal grievance processes, dispute resolution mechanisms, and restitution procedures for violations or disagreements over protected peatlands.
- Support high-integrity carbon markets, institutions, rules, and norms to cultivate the demand for high-quality carbon credits.
- Share data, information, and investment frameworks that successfully avoid deforestation to support protected peatlands, businesses, and investors.
- Help shift public narratives to mobilize public action and build political will for protecting peatlands by creating educational campaigns and strengthening networks of stakeholders and rightsholders.
- Amplify the voices of local communities and civil society to promote robust media coverage.
- Support Indigenous and local communities' capacity for legal protection and public relations.
Further information:
- Peatlands and climate change. IUCN (n.d.)
- Best practice book for peatland restoration and climate change mitigation. Pakalne (2021)
- Global peatlands assessment: the state of the world’s peatlands. UNEP (2022)
Technologists and Researchers
- Improve mapping of peatland area, carbon content, emissions data, and monitoring methods, utilizing field measurements, models, satellite imagery, and GIS tools.
- Develop land-use planning tools that help avoid infrastructure or development projects that may interfere with protecting peatlands or incentivize drainage.
- Create tools for local communities to monitor peatlands, such as mobile apps, e-learning platforms, and mapping tools.
- Develop verifiable carbon credits using technology such as blockchain to improve the integrity of carbon markets.
- Develop supply chain tracking software for investors and businesses seeking to create peat-free portfolios and products.
Further information:
- Peatlands and climate change. IUCN (n.d.)
- Best practice book for peatland restoration and climate change mitigation. Pakalne (2021)
- Global peatlands assessment: the state of the world’s peatlands. UNEP (2022)
Communities, Households, and Individuals
- Ensure purchases and investments utilize peat-free products and supply chains.
- Advocate for protecting peatlands and for public investments.
- Invest in fire warning, prevention, and response efforts and establish local volunteer fire prevention groups.
- Establish coordinating bodies for farmers, landowners, policymakers, and other stakeholders to manage protected areas holistically.
- Assist in managing and monitoring protected peatlands, utilizing real-time monitoring and satellite data.
- Assist in conducting proactive land-use planning to avoid infrastructure or development projects that may interfere with protected peatlands or incentivize drainage.
- Advocate for creating legal grievance processes, dispute resolution mechanisms, and restitution procedures for violations or disagreements over protected peatlands.
- Help shift public narratives to mobilize public action and build political will for protecting peatlands by creating educational campaigns and strengthening networks of stakeholders and rightsholders.
- Support Indigenous and local communities' capacity for legal protections and public relations.
Further information:
- Peatlands and climate change. IUCN (n.d.)
- Best practice book for peatland restoration and climate change mitigation. Pakalne (2021)
- Global peatlands assessment: the state of the world’s peatlands. UNEP (2022)
“Take Action” Sources
- Economics of peatlands conservation, restoration and sustainable management. Barbier et al. (2021)
- Lost in action: Climate friendly use of European peatlands needs coherence and incentive-based policies. Chen et al. (2023)
- Peatland protection and restoration are key for climate change mitigation. Humpenöder et al. (2020)
- Digging into complexity: the wicked problem of peatland protection. Meyer‐Jürshof et al. (2024)
- Tropical peatlands under siege: the need for evidence-based policies and strategies. Murdiyarso et al. (2019)
- National peatland strategies in Europe: current status, key themes, and challenges. Nordbeck et al. (2023)
- The case of conflicting Finnish peatland management – Skewed representation of nature, participation and policy instruments. Salomaa et al. (2018)
- Peatland policy and management strategy to support sustainable development in Indonesia. Syahza et al. (2020)
References
Adams, V. M., Iacona, G. D., & Possingham, H. P. (2019). Weighing the benefits of expanding protected areas versus managing existing ones. Nature Sustainability, 2(5), 404–411. Link to source: https://doi.org/10.1038/s41893-019-0275-5
Atkinson, C. L., & Alibašić, H. (2023). Prospects for governance and climate change resilience in peatland management in Indonesia. Sustainability, 15(3), Article 3. Link to source: https://doi.org/10.3390/su15031839
Austin, K. G., Elsen, P. R., Coronado, E. N. H., DeGemmis, A., Gallego-Sala, A. V., Harris, L., Kretser, H. E., Melton, J. R., Murdiyarso, D., Sasmito, S. D., Swails, E., Wijaya, A., Winton, R. S., & Zarin, D. (2025). Mismatch between global importance of peatlands and the extent of their protection. Conservation Letters, 18(1), e13080. Link to source: https://doi.org/10.1111/conl.13080
Barnes, M. D., Glew, L., Wyborn, C., & Craigie, I. D. (2018). Prevent perverse outcomes from global protected area policy. Nature Ecology & Evolution, 2(5), 759–762. Link to source: https://doi.org/10.1038/s41559-018-0501-y
Bruner, A. G., Gullison, R. E., & Balmford, A. (2004). Financial costs and shortfalls of managing and expanding protected-area systems in developing countries. BioScience, 54(12), 1119–1126. Link to source: https://doi.org/10.1641/0006-3568(2004)054[1119:FCASOM]2.0.CO;2
Conchedda, G., & Tubiello, F. N. (2020). Drainage of organic soils and GHG emissions: Validation with country data. Earth System Science Data, 12(4), 3113–3137. Link to source: https://doi.org/10.5194/essd-12-3113-2020
Davidson, N. C. (2014). How much wetland has the world lost? Long-term and recent trends in global wetland area. Marine and Freshwater Research, 65(10), 934. Link to source: https://doi.org/10.1071/MF14173
Deshmukh, C. S., Julius, D., Desai, A. R., Asyhari, A., Page, S. E., Nardi, N., Susanto, A. P., Nurholis, N., Hendrizal, M., Kurnianto, S., Suardiwerianto, Y., Salam, Y. W., Agus, F., Astiani, D., Sabiham, S., Gauci, V., & Evans, C. D. (2021). Conservation slows down emission increase from a tropical peatland in Indonesia. Nature Geoscience, 14(7), Article 7. Link to source: https://doi.org/10.1038/s41561-021-00785-2
Dietrich, O., & Behrendt, A. (2022). Wet grassland sites with shallow groundwater conditions: Effects on local meteorological characteristics. Water, 14(21), Article 21. Link to source: https://doi.org/10.3390/w14213560
Dinerstein, E., Joshi, A. R., Hahn, N. R., Lee, A. T. L., Vynne, C., Burkart, K., Asner, G. P., Beckham, C., Ceballos, G., Cuthbert, R., Dirzo, R., Fankem, O., Hertel, S., Li, B. V., Mellin, H., Pharand-Deschênes, F., Olson, D., Pandav, B., Peres, C. A., … Zolli, A. (2024). Conservation imperatives: Securing the last unprotected terrestrial sites harboring irreplaceable biodiversity. Frontiers in Science, 2. Link to source: https://doi.org/10.3389/fsci.2024.1349350
Evers, S., Yule, C. M., Padfield, R., O’Reilly, P., & Varkkey, H. (2017). Keep wetlands wet: The myth of sustainable development of tropical peatlands – implications for policies and management. Global Change Biology, 23(2), 534–549. Link to source: https://doi.org/10.1111/gcb.13422
Felipe Cadillo, M. M., & Bennett, A. (2024). Navigating socio-political threats to Amazonian peatland conservation: Insights from the Imiria Region, Peru. Sustainability, 16(16), Article 16. Link to source: https://doi.org/10.3390/su16166967
Fluet-Chouinard, E., Stocker, B. D., Zhang, Z., Malhotra, A., Melton, J. R., Poulter, B., Kaplan, J. O., Goldewijk, K. K., Siebert, S., Minayeva, T., Hugelius, G., Joosten, H., Barthelmes, A., Prigent, C., Aires, F., Hoyt, A. M., Davidson, N., Finlayson, C. M., Lehner, B., … McIntyre, P. B. (2023). Extensive global wetland loss over the past three centuries. Nature, 614(7947), 281–286. Link to source: https://doi.org/10.1038/s41586-022-05572-6
Fuller, C., Ondei, S., Brook, B. W., & Buettel, J. C. (2020). Protected-area planning in the Brazilian Amazon should prioritize additionality and permanence, not leakage mitigation. Biological Conservation, 248, 108673. Link to source: https://doi.org/10.1016/j.biocon.2020.108673
Garnett, S. T., Burgess, N. D., Fa, J. E., Fernández-Llamazares, Á., Molnár, Z., Robinson, C. J., Watson, J. E. M., Zander, K. K., Austin, B., Brondizio, E. S., Collier, N. F., Duncan, T., Ellis, E., Geyle, H., Jackson, M. V., Jonas, H., Malmer, P., McGowan, B., Sivongxay, A., & Leiper, I. (2018). A spatial overview of the global importance of Indigenous lands for conservation. Nature Sustainability, 1(7), 369–374. Link to source: https://doi.org/10.1038/s41893-018-0100-6
Girkin, N. T., & Davidson, S. J. (2024). Protect peatlands to achieve climate goals. Science, 383(6682), 490–490. Link to source: https://doi.org/10.1126/science.adn4001
Girkin, N. T., Burgess, P. J., Cole, L., Cooper, H. V., Honorio Coronado, E., Davidson, S. J., Hannam, J., Harris, J., Holman, I., McCloskey, C. S., McKeown, M. M., Milner, A. M., Page, S., Smith, J., & Young, D. (2023). The three-peat challenge: Business as usual, responsible agriculture, and conservation and restoration as management trajectories in global peatlands. Carbon Management, 14(1), 2275578. Link to source: https://doi.org/10.1080/17583004.2023.2275578
Goib, B. K., Fitriani, N., Wicaksono, S., & Chitra, J. (2018). Restoring peat, improving welfare, and empowering women: Can we have it all? Link to source: https://wri-indonesia.org/en/insights/restoring-peat-improving-welfare-and-empowering-women-can-we-have-it-all
Goldstein, A., Turner, W. R., Spawn, S. A., Anderson-Teixeira, K. J., Cook-Patton, S., Fargione, J., Gibbs, H. K., Griscom, B., Hewson, J. H., Howard, J. F., Ledezma, J. C., Page, S., Koh, L. P., Rockström, J., Sanderman, J., & Hole, D. G. (2020). Protecting irrecoverable carbon in Earth’s ecosystems. Nature Climate Change, 10(4), 287–295. Link to source: https://doi.org/10.1038/s41558-020-0738-8
Griscom, B. W., Adams, J., Ellis, P. W., Houghton, R. A., Lomax, G., Miteva, D. A., Schlesinger, W. H., Shoch, D., Siikamäki, J. V., Smith, P., Woodbury, P., Zganjar, C., Blackman, A., Campari, J., Conant, R. T., Delgado, C., Elias, P., Gopalakrishna, T., Hamsik, M. R., … Fargione, J. (2017). Natural climate solutions. Proceedings of the National Academy of Sciences, 114(44), 11645–11650. Link to source: https://doi.org/10.1073/pnas.1710465114
Harris, L. I., Richardson, K., Bona, K. A., Davidson, S. J., Finkelstein, S. A., Garneau, M., McLaughlin, J., Nwaishi, F., Olefeldt, D., Packalen, M., Roulet, N. T., Southee, F. M., Strack, M., Webster, K. L., Wilkinson, S. L., & Ray, J. C. (2022). The essential carbon service provided by northern peatlands. Frontiers in Ecology and the Environment, 20(4), 222–230. Link to source: https://doi.org/10.1002/fee.2437
Harrison, M. E., & Paoli, G. D. (2012). Managing the risk of biodiversity leakage from prioritising REDD+ in the most carbon-rich forests: The case study of peat-swamp forests in Kalimantan, Indonesia. Tropical Conservation Science, 5(4), 426–433. Link to source: https://doi.org/10.1177/194008291200500402
Hein, L., Spadaro, J. V., Ostro, B., Hammer, M., Sumarga, E., Salmayenti, R., Boer, R., Tata, H., Atmoko, D., & Castañeda, J.-P. (2022). The health impacts of Indonesian peatland fires. Environmental Health, 21(1), 62. Link to source: https://doi.org/10.1186/s12940-022-00872-w
Helbig, M., Waddington, J. M., Alekseychik, P., Amiro, B., Aurela, M., Barr, A. G., Black, T. A., Carey, S. K., Chen, J., Chi, J., Desai, A. R., Dunn, A., Euskirchen, E. S., Flanagan, L. B., Friborg, T., Garneau, M., Grelle, A., Harder, S., Heliasz, M., … Schulze, C. (2020). The biophysical climate mitigation potential of boreal peatlands during the growing season. Environmental Research Letters, 15(10), 104004. Link to source: https://doi.org/10.1088/1748-9326/abab34
Hugelius, G., Loisel, J., Chadburn, S., Jackson, R. B., Jones, M., MacDonald, G., Marushchak, M., Olefeldt, D., Packalen, M., Siewert, M. B., Treat, C., Turetsky, M., Voigt, C., & Yu, Z. (2020). Large stocks of peatland carbon and nitrogen are vulnerable to permafrost thaw. Proceedings of the National Academy of Sciences, 117(34), 20438–20446. Link to source: https://doi.org/10.1073/pnas.1916387117
Humpenöder, F., Karstens, K., Lotze-Campen, H., Leifeld, J., Menichetti, L., Barthelmes, A., & Popp, A. (2020). Peatland protection and restoration are key for climate change mitigation. Environmental Research Letters, 15(10), 104093. Link to source: https://doi.org/10.1088/1748-9326/abae2a
IPCC Task Force on National Greenhouse Gas Inventories. (2014). 2013 supplement to the 2006 IPCC guidelines for national greenhouse gas inventories: Wetlands (T. Hiraishi, T. Krug, K. Tanabe, N. Srivastava, J. Baasansuren, M. Fukuda, & T. G. Troxler, Eds.). Intergovernmental Panel on Climate Change. Link to source: https://www.ipcc.ch/site/assets/uploads/2018/03/Wetlands_Supplement_Entire_Report.pdf
IUCN. (2021). Peatlands and climate change (IUCN Issues Briefs). Link to source: https://iucn.org/sites/default/files/2022-04/iucn_issues_brief_peatlands_and_climate_change_final_nov21.pdf
IUCN UK Peatland Programme. (2024, July 10). New briefing addresses the peatlands and methane debate. Link to source: https://www.iucn-uk-peatlandprogramme.org/news/new-briefing-addresses-peatlands-and-methane-debate
Jalilov, S.-M., Rochmayanto, Y., Hidayat, D. C., Raharjo, J. T., Mendham, D., & Langston, J. D. (2025). Unveiling economic dimensions of peatland restoration in Indonesia: A systematic literature review. Ecosystem Services, 71, 101693. Link to source: https://doi.org/10.1016/j.ecoser.2024.101693
Jones, M. C., Harden, J., O’Donnell, J., Manies, K., Jorgenson, T., Treat, C., & Ewing, S. (2017). Rapid carbon loss and slow recovery following permafrost thaw in boreal peatlands. Global Change Biology, 23(3), 1109–1127. Link to source: https://doi.org/10.1111/gcb.13403
Kiely, L., Spracklen, D. V., Arnold, S. R., Papargyropoulou, E., Conibear, L., Wiedinmyer, C., Knote, C., & Adrianto, H. A. (2021). Assessing costs of Indonesian fires and the benefits of restoring peatland. Nature Communications, 12(1), 7044. Link to source: https://doi.org/10.1038/s41467-021-27353-x
Konecny, K., Ballhorn, U., Navratil, P., Jubanski, J., Page, S. E., Tansey, K., Hooijer, A., Vernimmen, R., & Siegert, F. (2016). Variable carbon losses from recurrent fires in drained tropical peatlands. Global Change Biology, 22(4), 1469–1480. Link to source: https://doi.org/10.1111/gcb.13186
Leifeld, J., & Menichetti, L. (2018). The underappreciated potential of peatlands in global climate change mitigation strategies. Nature Communications, 9(1), 1071. Link to source: https://doi.org/10.1038/s41467-018-03406-6
Leifeld, J., Wüst-Galley, C., & Page, S. (2019). Intact and managed peatland soils as a source and sink of GHGs from 1850 to 2100. Nature Climate Change, 9(12), 945–947. Link to source: https://doi.org/10.1038/s41558-019-0615-5
Li, B. V., Wu, S., Pimm, S. L., & Cui, J. (2024a). The synergy between protected area effectiveness and economic growth. Current Biology, 34(13), 2907-2920.e5. Link to source: https://doi.org/10.1016/j.cub.2024.05.044
Li, G., Fang, C., Watson, J. E. M., Sun, S., Qi, W., Wang, Z., & Liu, J. (2024b). Mixed effectiveness of global protected areas in resisting habitat loss. Nature Communications, 15(1), 8389. Link to source: https://doi.org/10.1038/s41467-024-52693-9
Loisel, J., Gallego-Sala, A. V., Amesbury, M. J., Magnan, G., Anshari, G., Beilman, D. W., Benavides, J. C., Blewett, J., Camill, P., Charman, D. J., Chawchai, S., Hedgpeth, A., Kleinen, T., Korhola, A., Large, D., Mansilla, C. A., Müller, J., van Bellen, S., West, J. B., … Wu, J. (2021). Expert assessment of future vulnerability of the global peatland carbon sink. Nature Climate Change, 11(1), 70–77. Link to source: https://doi.org/10.1038/s41558-020-00944-0
Marlier, M. E., Liu, T., Yu, K., Buonocore, J. J., Koplitz, S. N., DeFries, R. S., Mickley, L. J., Jacob, D. J., Schwartz, J., Wardhana, B. S., & Myers, S. S. (2019). Fires, smoke exposure, and public health: An integrative framework to maximize health benefits from peatland restoration. GeoHealth, 3(7), 178–189. Link to source: https://doi.org/10.1029/2019GH000191
Melton, J. R., Chan, E., Millard, K., Fortier, M., Winton, R. S., Martín-López, J. M., Cadillo-Quiroz, H., Kidd, D., & Verchot, L. V. (2022). A map of global peatland extent created using machine learning (Peat-ML). Geoscientific Model Development, 15(12), 4709–4738. Link to source: https://doi.org/10.5194/gmd-15-4709-2022
Miettinen, J., Shi, C., & Liew, S. C. (2011). Deforestation rates in insular Southeast Asia between 2000 and 2010. Global Change Biology, 17(7), 2261–2270. Link to source: https://doi.org/10.1111/j.1365-2486.2011.02398.x
Miettinen, J., Shi, C., & Liew, S. C. (2016). Land cover distribution in the peatlands of Peninsular Malaysia, Sumatra and Borneo in 2015 with changes since 1990. Global Ecology and Conservation, 6, 67–78. Link to source: https://doi.org/10.1016/j.gecco.2016.02.004
Minasny, B., Adetsu, D. V., Aitkenhead, M., Artz, R. R. E., Baggaley, N., Barthelmes, A., Beucher, A., Caron, J., Conchedda, G., Connolly, J., Deragon, R., Evans, C., Fadnes, K., Fiantis, D., Gagkas, Z., Gilet, L., Gimona, A., Glatzel, S., Greve, M. H., … Zak, D. (2024). Mapping and monitoring peatland conditions from global to field scale. Biogeochemistry, 167(4), 383–425. Link to source: https://doi.org/10.1007/s10533-023-01084-1
Minayeva, T. Yu., Bragg, O. M., & Sirin, A. A. (2017). Towards ecosystem-based restoration of peatland biodiversity. Mires and Peat, 19, 1–36. Link to source: https://doi.org/10.19189/MaP.2013.OMB.150
Müller, J., & Joos, F. (2021). Committed and projected future changes in global peatlands – continued transient model simulations since the Last Glacial Maximum. Biogeosciences, 18(12), 3657–3687. Link to source: https://doi.org/10.5194/bg-18-3657-2021
Nelson, K., Thompson, D., Hopkinson, C., Petrone, R., & Chasmer, L. (2021). Peatland-fire interactions: A review of wildland fire feedbacks and interactions in Canadian boreal peatlands. Science of The Total Environment, 769, 145212. Link to source: https://doi.org/10.1016/j.scitotenv.2021.145212
Noon, M. L., Goldstein, A., Ledezma, J. C., Roehrdanz, P. R., Cook-Patton, S. C., Spawn-Lee, S. A., Wright, T. M., Gonzalez-Roglich, M., Hole, D. G., Rockström, J., & Turner, W. R. (2022). Mapping the irrecoverable carbon in Earth’s ecosystems. Nature Sustainability, 5(1), 37–46. Link to source: https://doi.org/10.1038/s41893-021-00803-6
Pan, Y., Birdsey, R. A., Phillips, O. L., Houghton, R. A., Fang, J., Kauppi, P. E., Keith, H., Kurz, W. A., Ito, A., Lewis, S. L., Nabuurs, G.-J., Shvidenko, A., Hashimoto, S., Lerink, B., Schepaschenko, D., Castanho, A., & Murdiyarso, D. (2024). The enduring world forest carbon sink. Nature, 631(8021), 563–569. Link to source: https://doi.org/10.1038/s41586-024-07602-x
Peacock, M., Audet, J., Bastviken, D., Futter, M. N., Gauci, V., Grinham, A., Harrison, J. A., Kent, M. S., Kosten, S., Lovelock, C. E., Veraart, A. J., & Evans, C. D. (2021). Global importance of methane emissions from drainage ditches and canals. Environmental Research Letters, 16(4), 044010. https://doi.org/10.1088/1748-9326/abeb36
Posa, M. R. C., Wijedasa, L. S., & Corlett, R. T. (2011). Biodiversity and conservation of tropical peat swamp forests. BioScience, 61(1), 49–57. Link to source: https://doi.org/10.1525/bio.2011.61.1.10
Ritson, J. P., Bell, M., Brazier, R. E., Grand-Clement, E., Graham, N. J. D., Freeman, C., Smith, D., Templeton, M. R., & Clark, J. M. (2016). Managing peatland vegetation for drinking water treatment. Scientific Reports, 6(1), 36751. Link to source: https://doi.org/10.1038/srep36751
Sasmito, S. D., Taillardat, P., Adinugroho, W. C., Krisnawati, H., Novita, N., Fatoyinbo, L., Friess, D. A., Page, S. E., Lovelock, C. E., Murdiyarso, D., Taylor, D., & Lupascu, M. (2025). Half of land use carbon emissions in Southeast Asia can be mitigated through peat swamp forest and mangrove conservation and restoration. Nature Communications, 16(1), 740. Link to source: https://doi.org/10.1038/s41467-025-55892-0
Schulz, C., Martín Brañas, M., Núñez Pérez, C., Del Aguila Villacorta, M., Laurie, N., Lawson, I. T., & Roucoux, K. H. (2019). Uses, cultural significance, and management of peatlands in the Peruvian Amazon: Implications for conservation. Biological Conservation, 235, 189–198. Link to source: https://doi.org/10.1016/j.biocon.2019.04.005
Spitzer, K., & Danks, H. V. (2006). Insect biodiversity of boreal peat bogs. Annual Review of Entomology, 51, 137–161. Link to source: https://doi.org/10.1146/annurev.ento.51.110104.151036
Strack, M., Davidson, S. J., Hirano, T., & Dunn, C. (2022). The potential of peatlands as nature-based climate solutions. Current Climate Change Reports, 8(3), 71–82. Link to source: https://doi.org/10.1007/s40641-022-00183-9
Suwarno, A., Hein, L., & Sumarga, E. (2016). Who benefits from ecosystem services? A case study for central Kalimantan, Indonesia. Environmental Management, 57(2), 331–344. Link to source: https://doi.org/10.1007/s00267-015-0623-9
Syahza, A., Suswondo, Bakce, D., Nasrul, B., Irianti, W., & Irianti, M. (2020). Peatland policy and management strategy to support sustainable development in Indonesia. Journal of Physics: Conference Series, 1655, 012151. Link to source: https://doi.org/10.1088/1742-6596/1655/1/012151
Sze, J. S., Carrasco, L. R., Childs, D., & Edwards, D. P. (2021). Reduced deforestation and degradation in Indigenous Lands pan-tropically. Nature Sustainability, 5(2), 123–130. Link to source: https://doi.org/10.1038/s41893-021-00815-2
Tan, Z. D., Lupascu, M., & Wijedasa, L. S. (2021). Paludiculture as a sustainable land use alternative for tropical peatlands: A review. Science of The Total Environment, 753, 142111. Link to source: https://doi.org/10.1016/j.scitotenv.2020.142111
Thorburn, C. C., & Kull, C. A. (2015). Peatlands and plantations in Sumatra, Indonesia: Complex realities for resource governance, rural development and climate change mitigation. Asia Pacific Viewpoint, 56(1), 153–168. Link to source: https://doi.org/10.1111/apv.12045
Thornton, S. A., Setiana, E., Yoyo, K., Dudin, Yulintine, Harrison, M. E., Page, S. E., & Upton, C. (2020). Towards biocultural approaches to peatland conservation: The case for fish and livelihoods in Indonesia. Environmental Science & Policy, 114, 341–351. Link to source: https://doi.org/10.1016/j.envsci.2020.08.018
Turetsky, M. R., Benscoter, B., Page, S., Rein, G., van der Werf, G. R., & Watts, A. (2015). Global vulnerability of peatlands to fire and carbon loss. Nature Geoscience, 8(1), 11–14. Link to source: https://doi.org/10.1038/ngeo2325
Uda, S. K., Hein, L., & Sumarga, E. (2017). Towards sustainable management of Indonesian tropical peatlands. Wetlands Ecology and Management, 25(6), 683–701. Link to source: https://doi.org/10.1007/s11273-017-9544-0
Uda, S. K., Hein, L., & Atmoko, D. (2019). Assessing the health impacts of peatland fires: A case study for Central Kalimantan, Indonesia. Environmental Science and Pollution Research, 26(30), 31315–31327. Link to source: https://doi.org/10.1007/s11356-019-06264-x
UNEP. (2022). Global peatlands assessment: The state of the world’s peatlands: Evidence for action toward the conservation, restoration, and sustainable management of peatlands. Link to source: https://www.unep.org/resources/global-peatlands-assessment-2022
UNEP-WCMC and IUCN. (2024). Protected planet report. Link to source: https://digitalreport.protectedplanet.net
Waldron, A., Adams, V., Allan, J., Arnell, A., Asner, G., Atkinson, S., Baccini, A., Baillie, J. E. M., Balmford, A., Beau, J. A., Brander, L., Brondizio, E., Bruner, A., Burgess, N., Burkart, K., Butchart, S., Button, R., Carrasco, R., Cheung, W., …Zhang, Y. P. (2020). Protecting 30% of the planet for nature: Costs, benefits and economic implications. Link to source: https://pure.iiasa.ac.at/id/eprint/16560/1/Waldron_Report_FINAL_sml.pdf
Williams, M., Reay, D., & Smith, P. (2023). Avoiding emissions versus creating sinks—Effectiveness and attractiveness to climate finance. Global Change Biology, 29(8), 2046–2049. Link to source: https://doi.org/10.1111/gcb.16598
Wolf, C., Levi, T., Ripple, W. J., Zárrate-Charry, D. A., & Betts, M. G. (2021). A forest loss report card for the world’s protected areas. Nature Ecology & Evolution, 5(4), 520–529. Link to source: https://doi.org/10.1038/s41559-021-01389-0
Worrall, F., Howden, N. J. K., Burt, T. P., Rico-Ramirez, M. A., & Kohler, T. (2022). Local climate impacts from ongoing restoration of a peatland. Hydrological Processes, 36(3), e14496. Link to source: https://doi.org/10.1002/hyp.14496
Xu, J., Morris, P. J., Liu, J., & Holden, J. (2018a). Hotspots of peatland-derived potable water use identified by global analysis. Nature Sustainability, 1(5), 246–253. Link to source: https://doi.org/10.1038/s41893-018-0064-6
Xu, J., Morris, P. J., Liu, J., & Holden, J. (2018b). PEATMAP: Refining estimates of global peatland distribution based on a meta-analysis. CATENA, 160, 134–140. Link to source: https://doi.org/10.1016/j.catena.2017.09.010
Yu, Z., Loisel, J., Brosseau, D. P., Beilman, D. W., & Hunt, S. J. (2010). Global peatland dynamics since the Last Glacial Maximum. Geophysical Research Letters, 37(13), L13402. Link to source: https://doi.org/10.1029/2010GL043584
Appendix
This analysis quantifies the emissions associated with peatland degradation and their potential reduction via establishment of Protected Areas (PAs). We leveraged multiple data products, including national-scale peatland area estimates, a peatland distribution map, shapefiles of PAs and Indigenous peoples’ lands, available data on rates of peatland degradation by driver, country-scale data on reductions in ecosystem degradation inside of PAs, maps of biomass carbon stocks, and biome-level emissions factors from disturbed peat soils. This appendix describes the source data products and how they were integrated.
Peatland Extent
The global extent and distribution of peatlands is highly uncertain, and all existing peatland maps have limitations. Importantly, there is no globally accepted definition of a peatland, and different countries and data products use variable thresholds for peat depth and carbon content to define peatlands. The Global Peatland Assessment was a recent comprehensive effort to compile and harmonize existing global peatland area estimates (UNEP, 2022). We rely heavily on two products resulting from this effort: a national-scale dataset of peatland area titled the Global Peatland Database (GPD) and a map of likely peatland areas titled the Global Peatlands Map (GPM; 1 km resolution).
Scaling Procedures
The GPM represents a known overestimate of the global peatland area, so we scaled area estimates derived from spatially explicit analyses dependent on the GPM to match total areas from the GPD. To develop a map of country-level scaling factors, we first calculated the peatland area within each country from the GPM. We calculated the country-level scaling factors as the country-level GPD values divided by the associated GPM values and converted them to a global raster. Some countries had peatland areas represented in either the GPD or GPM, but not both. Four countries had peatland areas in the GPM that were not present in the GPD, which contained 0.51 Mha of peatlands per the GPM. These areas were left unscaled. There were 38 countries with peatland areas in the GPD that did not have areas in the GPM, containing a total 0.70 Mha of peatlands. These areas, which represented 0.14% of the total peatland area in the GPD, were excluded from the scaled maps. We then multiplied the pixel-level GPM values by the scalar raster. Because of the missing countries, this scaling step very slightly overestimated (by 0.4%) total peatlands relative to the GPD. To account for this, we multiplied this intermediate map by a final global scalar (calculated as the global GPM total divided by the GPD total). This process produced a map with the same peatland distribution as the GPM but a total area that summed to that reported in the GPD.
Exclusion of Coastal Peatlands
Many coastal wetlands have peat soils, though the extent of this overlap has not been well quantified. Coastal wetlands are handled in the Protect Coastal Wetlands solution, so we excluded them from this solution to avoid double-counting. Because of the large uncertainties in both the peatland maps and available maps of coastal wetlands, we were not confident that the overlap between the two sets of maps provided a reliable estimate of the proportion of coastal wetlands located on peat soils. Therefore, we took the conservative approach of excluding all peatland pixels that were touching or overlapping with the coastline. This reduced the total peatland area considered in this solution by 5.33 Mha (1.1%). We additionally excluded degraded peatlands from the adoption ceiling and achievable range using country-level data from the GPD. Degraded peatlands will continue to be emissions sources until they are restored, so protection alone will not confer an emissions benefit.
Total Peatland Area
We conducted the analyses by latitude bands (tropical: –23.4° to 23.4°; subtropical: –35° to –23.4° and 23.4° to 35°; temperate: –35° to –50° and 35° to 50°; boreal: <–50° and >50°) in order to retain some spatial variability in emissions factors and degradation rates and drivers. We calculated the total peatland area within each latitude band based on both the scaled and unscaled peatland maps with coastal pixels excluded. We used these values as the adoption ceiling and for subsequent calculations of protected areas.
Protected Peatland Areas
We identified protected peatland areas using the World Database on Protected Areas (WDPA, 2024), which contains boundaries for each PA and additional information, including their establishment year and IUCN management category (Ia to VI, not applicable, not reported, and not assigned). For each PA polygon, we extracted the peatland area from the unscaled version of the GPM with coastal pixels removed.
Each PA was classified into climate zones (described above) based on the midpoint between its minimum and maximum latitude. Then, protected peatland areas were summed to the IUCN class-climate zone level, and the proportion of peatlands protected within each was calculated by dividing the protected area by the unscaled total area in each climate zone. The proportion of area protected was then multiplied by the scaled total area for each zone to calculate adoption in hectares within each IUCN class and climate zone. To evaluate trends in adoption over time, we aggregated protected areas by establishment year as reported in the WDPA. We used the same procedure to calculate the proportion of area protected using the unscaled maps, and then scale for the total area by biome.
We used the maps of Indigenous people’s lands from Garnett et al. 2018 to identify Indigenous people’s lands that were not inside of established PAs. The total peatland area within Indigenous people’s lands process as above.
Peatland Degradation and Emissions
Broadly, we estimated annual, per-ha emissions savings from peatland protection as the difference between net carbon exchange in a protected peatland versus an unprotected peatland, accounting for all emissions pathways, the drivers of disturbance, the baseline rates of peatland disturbance, and the effectiveness of PAs at reducing ecosystem degradation. In brief, our calculation of the effectiveness of peatland protection followed Equation S1, in which the annual peatland loss avoided due to protection (%/yr) is multiplied by the 30-yr cumulative sum of emissions per ha of degraded peatland (CO₂‑eq /ha over a 30-yr period). These two terms are described in depth in the subsequent sections.
Equation A1.
Peatland Degradation Rates
We calculated the avoided rate of peatland loss (%/yr) as the difference between the baseline rate of peatland loss without protection and the estimated rate of peatland loss within PAs (Equation A2), since PAs do not confer complete protection from ecosystem degradation.
Equation A2.
We compiled baseline estimates of the current rates of peatland degradation from all causes (%/yr) from the existing literature (Table A1). Unfortunately, data on the rate of peatland loss within PAs are not available. However, satellite data have enabled in-depth, global-scale studies of the effectiveness of PAs at reducing tree cover loss. While not all peatlands are forested and degradation dynamics on peatlands can differ from those on forests writ large, these estimates are a reasonable approximation of the effectiveness of PAs at reducing peatland loss. We used the country-level estimates of the proportionate reduction in loss inside versus outside of PAs from Wolf et al. (2021), which we aggregated to latitude bands based on the median latitude of each country (Table A1).
Table A1. Biome-level annual baseline rate of peatland loss, the effectiveness of protection at reducing loss, and the annual avoided rate of peatland loss under protection.
| Climate Zone | Mean Annual Peatland Loss (%/yr) | Proportionate Reduction in Loss Under Protection | Avoided Loss Under Protection (%/yr) |
|---|---|---|---|
| Boreal | 0.3% | 0.44 | 0.13% |
| Subtropic | 1.2% | 0.60 | 0.73% |
| Temperate | 0.6% | 0.56 | 0.33% |
| Tropic | 1.5% | 0.41 | 0.63% |
Emissions Factors for Peatland Degradation
Equation S3 provides an overview of the calculation of emissions from degraded peatlands. In brief, we calculated cumulative emissions as the biomass carbon stock plus the 30-yr total of CO₂‑equivalent fluxes from peat oxidation (Pox), dissolved organic carbon losses (DOC), methane from drainage ditches (Mditch), on-field methane (Mfield), on-field nitrous oxide (N) and the lost net sequestration from an intact peatland, accounting for carbon sequestration in peat and methane emissions from intact peatlands (Seqloss).
Equation A3.
The IPCC Tier 1 emissions factors for peatland degradation are disaggregated by climate zone (tropical, temperate, and boreal), soil fertility status (nutrient-poor versus nutrient rich), and the driver of degradation (many subclasses of forestry, cropland, grassland, and peat extraction) (IPCC 2014; Tables 2.1–2.5). Table III.5 of Annex III of the Global Peatlands Assessment provides a summarized set of emissions factors based directly on the IPCC values but aggregated to the four coarser classes of degradation drivers listed above (UNEP, 2022), which we use for our analysis. They include the following pathways: CO₂ from peat oxidation, off-site emissions from lateral transport of dissolved organic carbon (DOC), methane emissions from the field and drainage ditches, and nitrous oxide emissions from the field. Particulate organic carbon (POC) losses may be substantial, but were not included in the IPCC methodology due to uncertainties about the fate of transported POC. These emissions factors are reported as annual rates per disturbed hectare, and emissions from these pathways continue over long periods of time.
Three additional pathways that are not included in the IPCC protocol are relevant to the emissions accounting for this analysis: the loss of carbon sequestration potential from leaving the peatland intact, the methane emissions that occur from intact peatlands, and the emissions from removal of the vegetation overlying peat soils. Leifield et al. (2019) reported the annual net carbon uptake per hectare of intact peatlands, including sequestration of carbon in peat minus naturally occurring methane emissions due to the anoxic conditions. If the peatland is not disturbed, these methane emissions and carbon sequestration will persist indefinitely on an annual basis.
We accounted for emissions from removal of biomass using a separate protocol than emissions occurring from the peat soil due to differences in the temporal dynamics of loss. While all other emissions from peat occur on an annual basis and continue for many decades or longer, emissions from biomass occur relatively quickly. Biomass clearing produces a rapid pulse of emissions from labile carbon pools followed by a declining, but persistent, rate of emissions as more recalcitrant carbon pools decay over subsequent years. The entire biomass carbon stock is likely to be lost within 30 years. Average biomass carbon stocks over the extent of the peatland distribution in the GPM were calculated by latitude band based on the above and below ground biomass carbon stock data from Spawn et al. (2020). We presumed 100% of the biomass carbon stock is lost from peatland degradation, though in many cases some amount of biomass remains following degradation, depending on the terminal land use.
Peatland Degradation Drivers
Emissions from peatland loss depend on the driver of degradation (e.g., forestry, cropland, peat extraction; IPCC 2014). The GPD contains national-scale estimates of historical peatland loss by driver, which we used to calculate weights for each driver, reflecting the proportion of peatland loss attributable to each driver by latitude band. We took the weighted average of the driver-specific peatland emissions factors, calculated as the sum of the products of the weights and the driver-specific emissions factors.
Appendix References
Garnett, S. T., Burgess, N. D., Fa, J. E., Fernández-Llamazares, Á., Molnár, Z., Robinson, C. J., Watson, J. E. M., Zander, K. K., Austin, B., Brondizio, E. S., Collier, N. F., Duncan, T., Ellis, E., Geyle, H., Jackson, M. V., Jonas, H., Malmer, P., McGowan, B., Sivongxay, A., & Leiper, I. (2018). A spatial overview of the global importance of Indigenous lands for conservation. Nature Sustainability, 1(7), 369–374. https://doi.org/10.1038/s41893-018-0100-6
IPCC Task Force on National Greenhouse Gas Inventories. (2014). 2013 supplement to the 2006 IPCC guidelines for national greenhouse gas inventories: Wetlands (T. Hiraishi, T. Krug, K. Tanabe, N. Srivastava, J. Baasansuren, M. Fukuda, & T. G. Troxler, Eds.). Intergovernmental Panel on Climate Change. https://www.ipcc.ch/site/assets/uploads/2018/03/Wetlands_Supplement_Entire_Report.pdf
Leifeld, J., Wüst-Galley, C., & Page, S. (2019). Intact and managed peatland soils as a source and sink of GHGs from 1850 to 2100. Nature Climate Change, 9(12), 945–947. https://doi.org/10.1038/s41558-019-0615-5
Spawn, S. A., Sullivan, C. C., Lark, T. J., & Gibbs, H. K. (2020). Harmonized global maps of above and belowground biomass carbon density in the year 2010. Scientific Data, 7(1), 112. https://doi.org/10.1038/s41597-020-0444-4
UNEP. (2022). Global peatlands assessment: The state of the world’s peatlands: Evidence for action toward the conservation, restoration, and sustainable management of peatlands. https://www.unep.org/resources/global-peatlands-assessment-2022
UNEP-WCMC and IUCN (2024), Protected Planet: The World Database on Protected Areas (WDPA) and World Database on Other Effective Area-based Conservation Measures (WD-OECM) [Online], Accessed November 2024, Cambridge, UK: UNEP-WCMC and IUCN. Available at: www.protectedplanet.net.
Wolf, C., Levi, T., Ripple, W. J., Zárrate-Charry, D. A., & Betts, M. G. (2021). A forest loss report card for the world’s protected areas. Nature Ecology & Evolution, 5(4), 520–529. https://doi.org/10.1038/s41559-021-01389-0
Credits
Lead Fellow
Avery Driscoll
Contributors
Ruthie Burrows, Ph.D.
James Gerber, Ph.D.
Daniel Jasper
Alex Sweeney
Internal Reviewers
Aiyana Bodi
Hannah Henkin
Megan Matthews, Ph.D.
Ted Otte
Christina Swanson, Ph.D.
Paul C. West, Ph.D.